Client reporting without
per-client or per-source pricing
Automated marketing reports built for solo consultants and small agencies who are tired of enterprise billing models.
Trusted by 5000+ marketing professionals


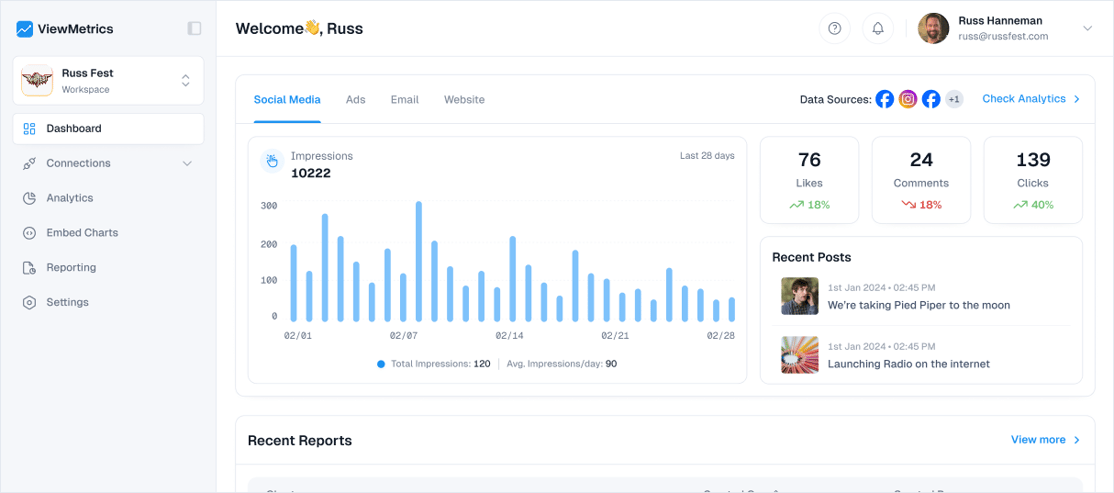
Spend less time reporting. Spend less money doing it.
Automate reporting with our Google Workspace Integration
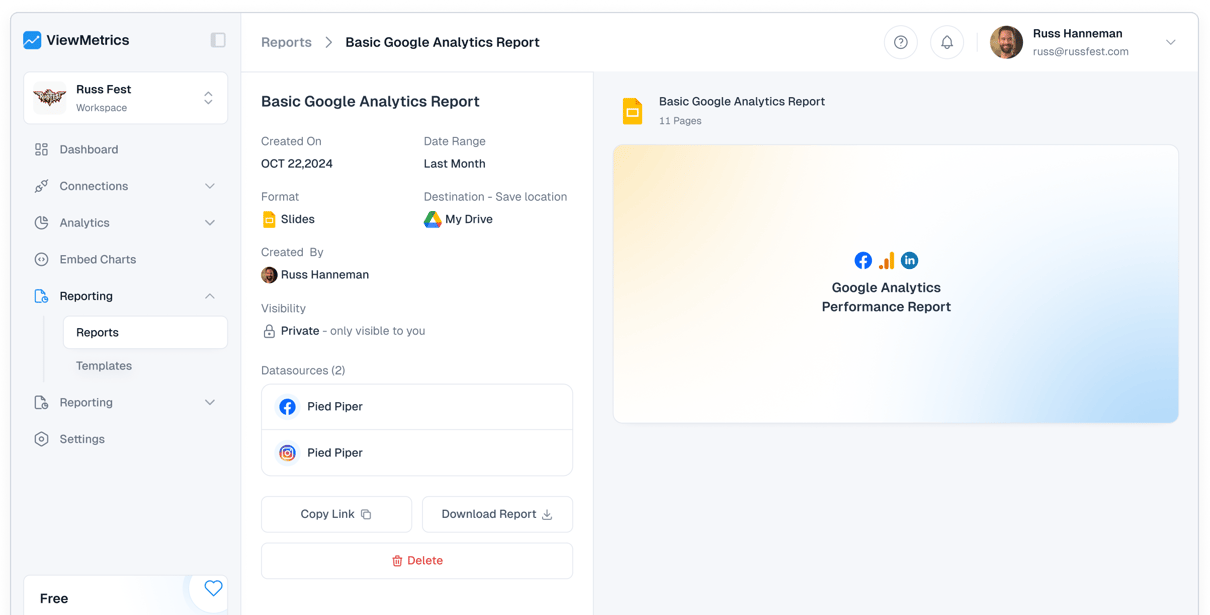
Design a template in Google Slides or Google Sheets (or choose from one of our pre-built ones) and leverage ViewMetrics to automatically insert metrics, charts, screenshots, and more.Learn more
Sync charts once, keep them updated everywhere
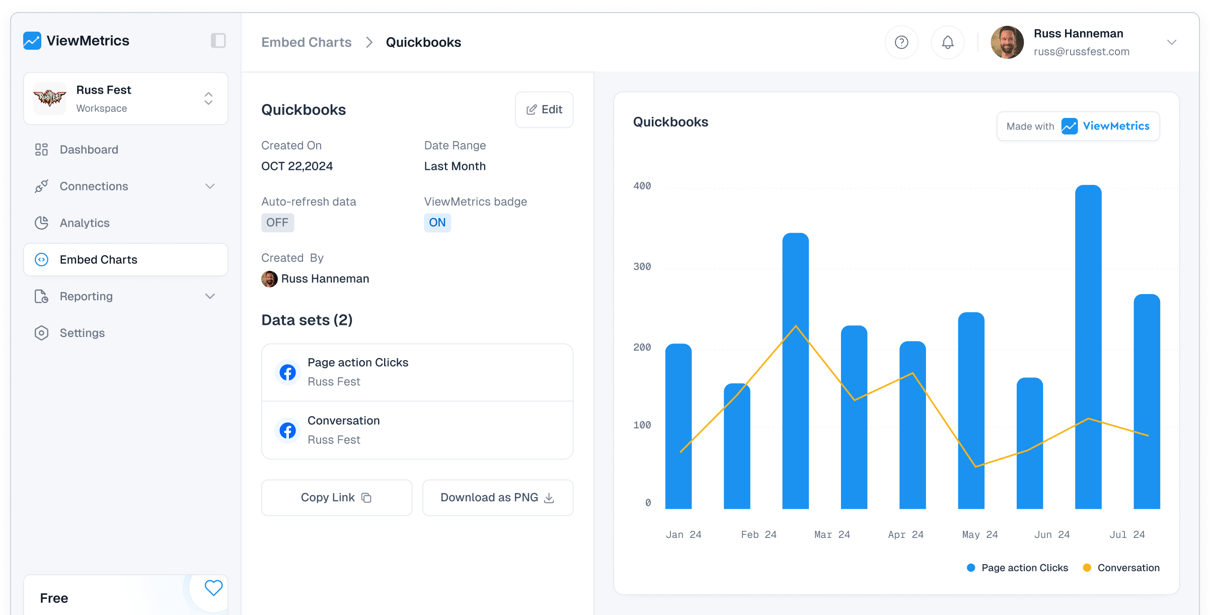
Create custom charts and embed them in your favorite online tools such as Notion, Confluence, or even your own website.Learn more
Reuse the same dashboards without extra fees
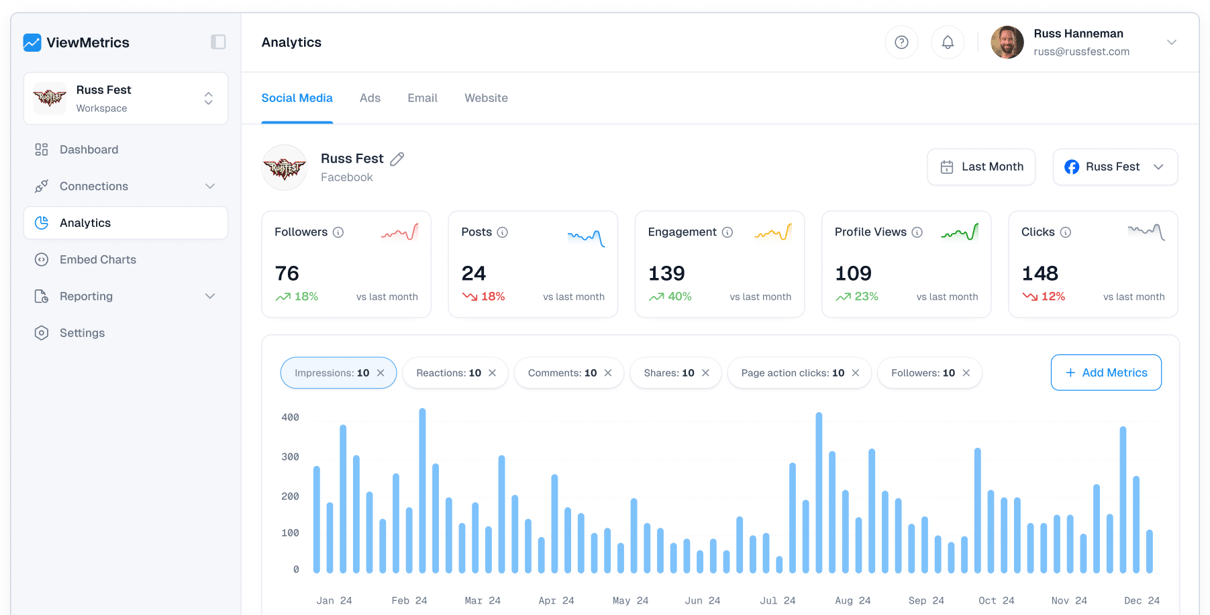
Track social, ad, and email campaign performance on dedicated analytics dashboards. Create and share dedicated workspaces for each of your clients.Learn more
Automate reporting with our Google Workspace Integration
Design a template in Google Slides or Google Sheets (or choose from one of our pre-built ones) and leverage ViewMetrics to automatically insert metrics, charts, screenshots, and more.
Sync charts once, keep them updated everywhere
Create custom charts and embed them in your favorite online tools such as Notion, Confluence, or even your own website.
Reuse the same dashboards without extra fees
Track social, ad, and email campaign performance on dedicated analytics dashboards. Create and share dedicated workspaces for each of your clients.
All your marketing reports in one
dashboard
All your marketing reports in one dashboard
Manage Multiple Workspaces with Ease
Manage client reports in separate workspaces - perfect for consultants and solo agencies juggling multiple clients.
Invite collaborators when needed
Add teammates or clients only when you need them. No forced seats or bloated plans.
Download charts easily
Quickly export charts for client reports, decks, or invoices.
Sync your data flexibly
Sync your reports daily, weekly, or monthly. No manual updates. No recurring setup work.
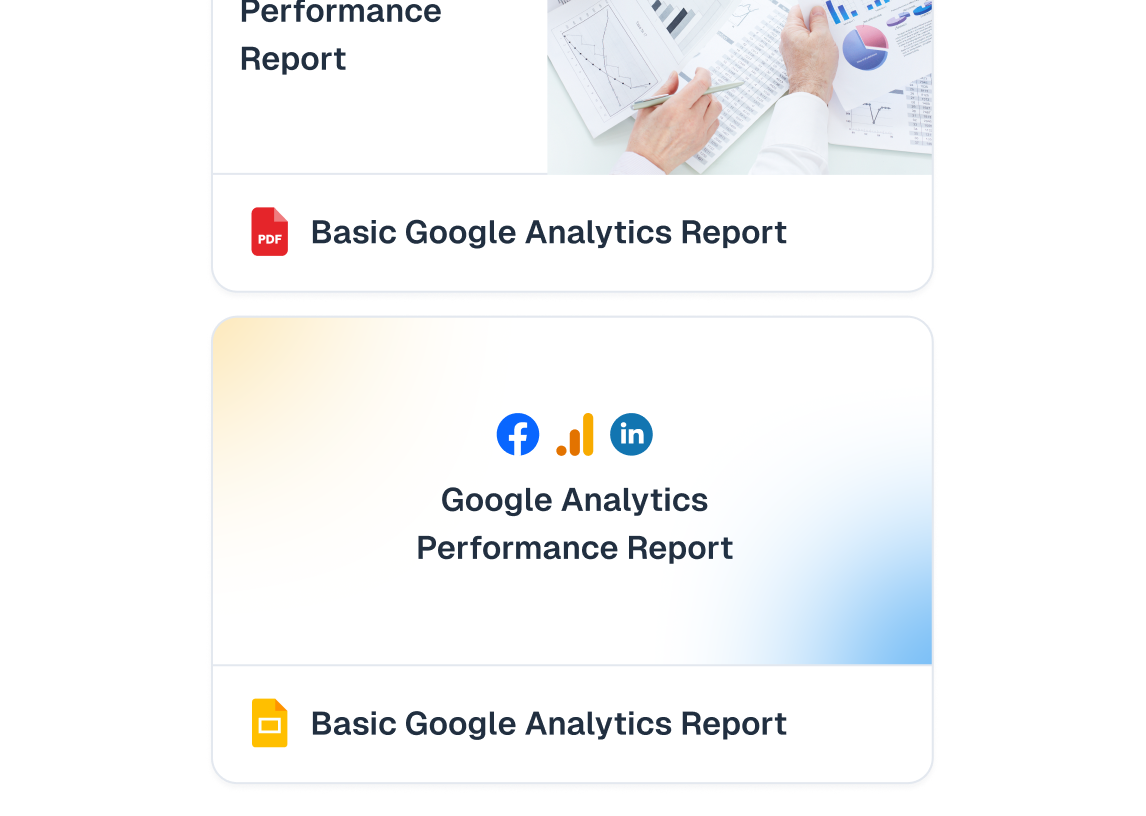
Pick the right Template
Choose from ready-made templates or reuse your own across all clients.
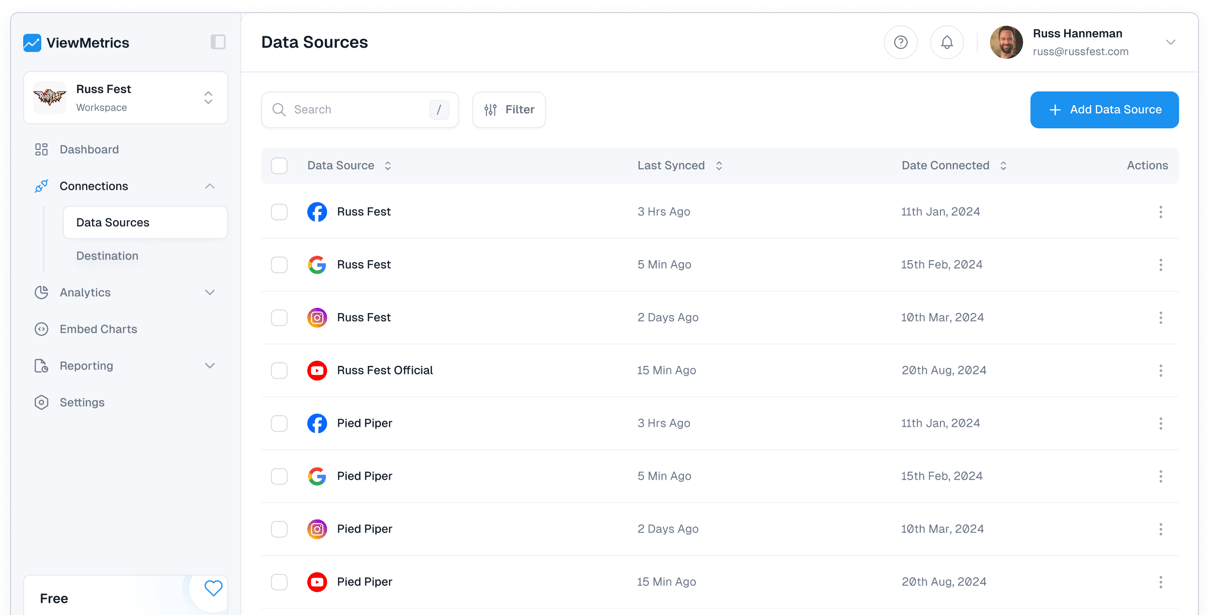
Connect your marketing tools - without paying per connection
Seamlessly connect all your marketing tools and data sources for a unified reporting experience.
Simple, flat pricing - no per-client surprises
Built for consultants and small agencies, no enterprise billing models.
Free
billed yearly
Features
- 1 Account
- 1 Workspace
- 1 User
- Analytics Dashboard
- Google Add-on
- Reporting
Starter
billed yearly
Features
- 5 Accounts
- 2 Workspaces
- 1 User
- Analytics Dashboard
- Google Add-on
- Reporting
Professional
billed yearly
Features
- 50 Accounts
- 5 Workspaces
- 5 Users
- Analytics Dashboard
- Google Add-on
- Reporting
Team
billed yearly
Features
- Unlimited Accounts
- 20 Workspaces
- 20 Users
- Analytics Dashboard
- Google Add-on
- Reporting
Need to see more?
Find what's best for you
Don’t just take our word for it
ViewMetrics’ social analytics tool has provided great insights into social channels for our clients and has become an integral part of our content marketing strategies.

Frequently asked questions
Automated client reporting - without enterprise pricing
Get Started for Free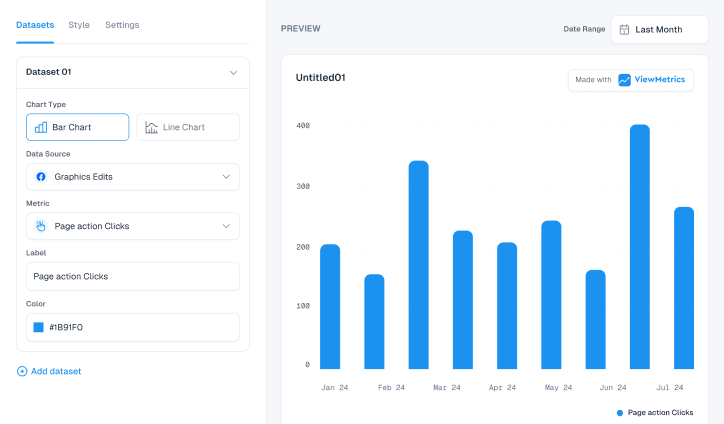
Design That Stands Out
Elevate visuals effortlessly with customizable styling options tailored to match brand aesthetics.
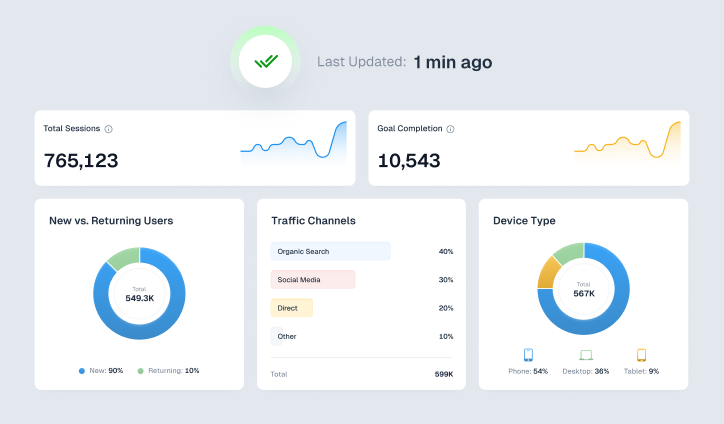
Effortless Data Syncing
Keep insights up-to-date with seamless and flexible data synchronization across platforms.
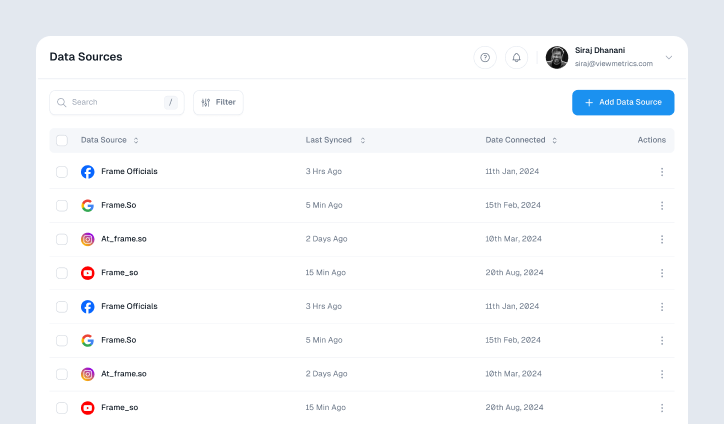
Connect with Ease
Integrate effortlessly with leading platforms to streamline workflows and maximize efficiency.
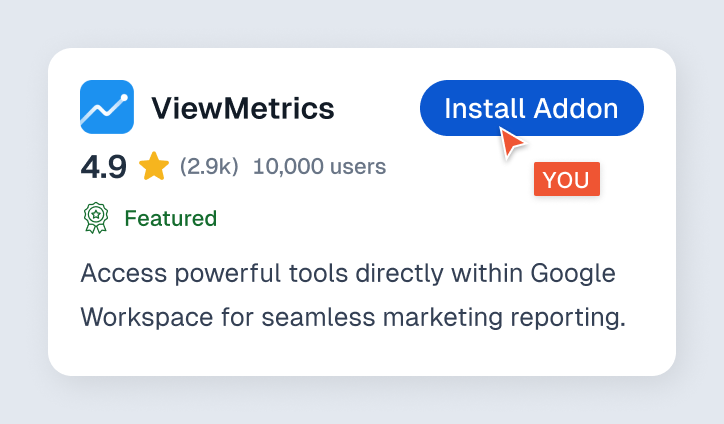
Boost Productivity with Google Add-On
Access powerful tools directly within Google Workspace for seamless marketing reporting.
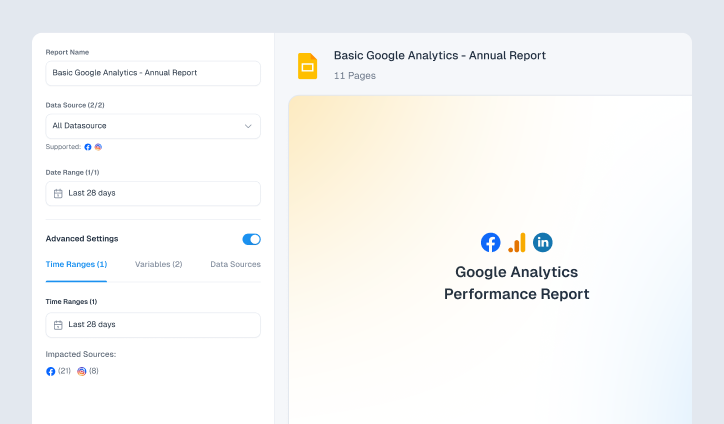
Custom Reports, Instant Insights
Generate tailored marketing reports effortlessly, delivering key insights in just a few clicks.
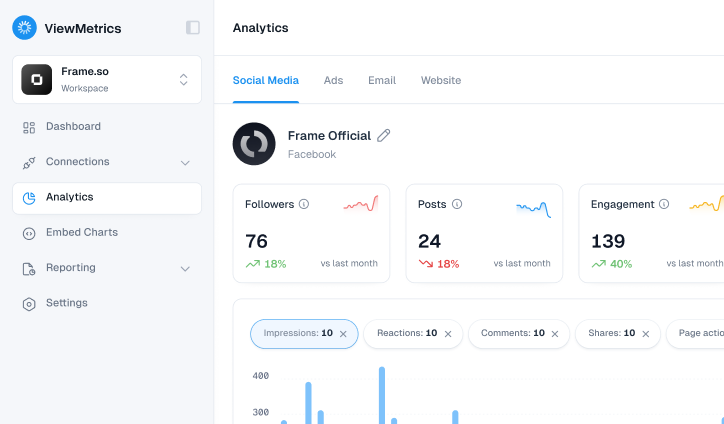
Actionable Analytics at a Glance
Access in-depth analytics to uncover trends, optimize strategies, and drive impactful decisions.
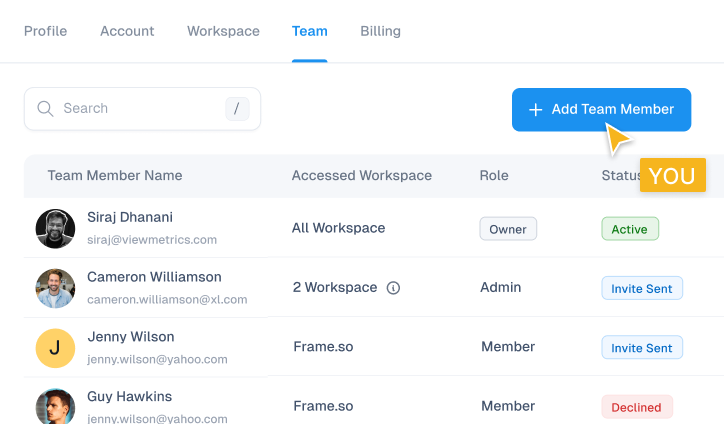
Collaborate with Ease
Invite team members to share insights, streamline workflows, and work together seamlessly.

Design That Stands Out
Elevate visuals effortlessly with customizable styling options tailored to match brand aesthetics.

Effortless Data Syncing
Keep insights up-to-date with seamless and flexible data synchronization across platforms.

Connect with Ease
Integrate effortlessly with leading platforms to streamline workflows and maximize efficiency.

Boost Productivity with Google Add-On
Access powerful tools directly within Google Workspace for seamless marketing reporting.

Custom Reports, Instant Insights
Generate tailored marketing reports effortlessly, delivering key insights in just a few clicks.

Actionable Analytics at a Glance
Access in-depth analytics to uncover trends, optimize strategies, and drive impactful decisions.

Collaborate with Ease
Invite team members to share insights, streamline workflows, and work together seamlessly.

Design That Stands Out
Elevate visuals effortlessly with customizable styling options tailored to match brand aesthetics.

Effortless Data Syncing
Keep insights up-to-date with seamless and flexible data synchronization across platforms.

Connect with Ease
Integrate effortlessly with leading platforms to streamline workflows and maximize efficiency.

Boost Productivity with Google Add-On
Access powerful tools directly within Google Workspace for seamless marketing reporting.

Custom Reports, Instant Insights
Generate tailored marketing reports effortlessly, delivering key insights in just a few clicks.

Actionable Analytics at a Glance
Access in-depth analytics to uncover trends, optimize strategies, and drive impactful decisions.

Collaborate with Ease
Invite team members to share insights, streamline workflows, and work together seamlessly.