Imagine spending hours writing the perfect blog post, adding keywords like a pro, even tossing in a few spicy backlinks, only to check your analytics and see… crickets. No clicks, no traffic, nothing. You sit there wondering if Google just forgot you exist. That’s where SEO KPIs come in. They help you figure out what’s really happening behind the scenes, so you’re not just guessing in the dark or blaming the algorithm every time your post flops. In this list, we’ll walk through 17 SEO KPIs you should be tracking in 2025. Let’s get started.
What are SEO KPIs?
SEO KPIs are the numbers that show how well your website is doing in search engines. They help you track whether your SEO efforts are actually working or just taking up space. You’ll be looking at things like how much organic traffic you’re getting, where your keywords are ranking, how often people are clicking your links, how many of them are converting, and how strong your backlink profile is. These KPIs give you a clear picture of what’s working, what’s not, and where to focus next.
Why Tracking SEO KPIs Matters
If you’re serious about improving your SEO, tracking the right KPIs is non-negotiable. Here’s why it makes a real difference:
-
Helps Measure ROI from SEO Campaigns
You need to know if your SEO efforts are paying off. Tracking KPIs shows you exactly how your campaigns are performing and what kind of return you’re getting on your investment.
-
Provides Insights for Decision-Making
Good data leads to better decisions. SEO KPIs help you understand what’s working and where you need to make changes, so you’re not just guessing your next move.
-
Improves Alignment with Business Goals
Whether your goals are about getting more visitors, collecting leads, or boosting conversions, KPIs help you stay on track and align your SEO work with the bigger business picture.
-
Identifies Gaps and Opportunities
KPI tracking helps you find what’s missing and where you can improve. Maybe a certain page isn’t converting, or a keyword opportunity is being overlooked. These insights help you fix what’s broken and build on what’s working.
-
Demonstrates Value to Clients and Stakeholders
Whether you’re managing SEO for a client or reporting internally, KPIs help you prove the impact of your work. You’re not just saying your SEO is working. You’re proving it with numbers.
Best SEO KPIs to Track in 2025
-
Organic Traffic
Organic traffic refers to visitors who land on your website by clicking on unpaid search results. This is one of the most basic yet important SEO metrics. It gives you a clear view of how well your content is showing up in search engines and how many users are arriving naturally, without any paid promotion.
In 2025, organic traffic can be segmented more precisely. You can break it down by location, device type, landing page, and even search engine (like Google, Bing, or DuckDuckGo). This helps you understand exactly which parts of your strategy are working and where there’s room for improvement.
Why it matters:
- Shows how visible your website is in organic search
- Reflects how well your content is matched to user search intent
- Helps identify top-performing topics and pages
- Acts as the foundation for deeper SEO analysis
How to track it:
- In Google Analytics 4, go to Reports > Traffic Acquisition and filter for “Organic Search.”
- In Google Search Console, use the Performance report for clicks, impressions, and CTR.
- SEO tools like Ahrefs, SEMrush, or Moz: These help estimate traffic and compare with competitors.
- Always segment by device, region, and landing pages to spot trends and gaps
-
Conversion Rate (Leads or Sales)
Conversion rate measures how many visitors from organic search end up taking a desired action. That could be making a purchase, submitting a contact form, subscribing to a newsletter, or any other defined goal. This metric focuses only on users who arrive through search engines, so you get a better idea of how qualified your search traffic really is.
If your traffic is growing but conversions are not, it may mean your content needs better alignment with user expectations. On the other hand, a steady or rising conversion rate usually signals that your pages are attracting the right audience.
Why it Matters:
- Helps assess the quality of traffic coming from search
- Points out which pages are contributing most to business outcomes
- Shows whether your content and calls-to-action are working well
- Guides you in refining the user experience on important landing pages
How to Track It:
- In Google Analytics 4, set up conversion events and apply filters for organic sessions
- In Google Search Console + GA4 link, combine data to connect search performance with conversions
- In your E-commerce dashboards, monitor revenue and transaction data tied to organic visitors
- Use this formula: (Organic conversions ÷ Organic sessions) × 100
-
SEO ROI (Return on Investment)
SEO ROI compares how much revenue your SEO efforts bring in with how much you’ve spent on them. It includes all costs, like tools, writers, developers, and any other resources. This metric is important for showing whether your investment is actually helping the business grow.
Why it matters:
- Makes it easier to justify SEO budgets to decision-makers
- Compares SEO performance with other marketing channels
- Helps identify which SEO tasks are most profitable
- Useful for long-term planning and hiring decisions
How to track it:
- Use this formula: [(Revenue from SEO – SEO Costs) ÷ SEO Costs] × 100
- Make sure to include all relevant costs, including tools, content, and team efforts
-
Keyword Rankings
Keyword rankings show where your website appears on search engine results pages for specific search terms. This metric tells you if your content is being indexed properly and how it is performing compared to competitors. It also helps you track progress on specific keywords that matter to your business.
Modern rank tracking includes variations by location, user behavior, and search features like featured snippets. So, rather than looking at a single position, it’s helpful to track rankings across groups like top 3, top 10, or top 20 results.
Why it matters:
- Offers early signs of progress before traffic starts to rise
- Lets you track visibility for targeted keywords
- Helps spot content gaps and areas needing optimization
- Supports long-term SEO campaigns focused on specific phrases
How to track it:
- In Google Search Console, use average position metrics in the Performance report
- In SEMrush, Ahrefs, and SE Ranking, use for keyword monitoring and historical trend analysis
- Track changes across keyword clusters instead of focusing on single terms
-
Click-Through Rate (CTR)
CTR measures how many people click on your link after seeing it in search results. If your CTR is low, your page may not look appealing or relevant to users. Improving this often starts with clearer titles and more helpful descriptions.
Why it matters:
- Reflects how compelling your search result is
- Can impact your ranking if users consistently ignore your listing
- Helps refine metadata to increase engagement
- Reveals opportunities for improving snippet visibility and appearance
How to track it:
- In Google Search Console, check CTR by query, page, country, or device
- Use this formula: (Clicks ÷ Impressions) × 100
- Monitor trends after making changes to titles or descriptions
- Compare CTR on different page types to learn what draws more clicks
-
Organic Impressions
Organic impressions count how often your website shows up in search results, even if the user doesn’t click. This helps you track your search visibility and understand how frequently your content is being matched to relevant queries.
Why it matters:
- Shows how often your content appears for search queries
- Helps detect changes in visibility before traffic drops
- Useful for spotting seasonal trends or ranking fluctuations
- Helps confirm if new content is getting indexed and noticed
How to track it:
- In Google Search Console, use the Performance report to track impressions over time
- Segment data by page, query, country, and device
- Compare impressions before and after publishing new content
- Use tools like SEMrush to check impression share against competitors
-
Share of Voice (Visibility)
Share of Voice (SOV) tracks how often your brand appears in search results compared to your competitors. It looks at the percentage of visibility you hold across your target keywords, giving you a clear picture of how much attention your content is capturing in your market. This helps you measure your standing and see where you can gain more ground.
In 2025, this includes both traditional search listings and AI-generated search responses, making it even more important for monitoring overall reach.
Why it matters:
- Shows how visible your brand is compared to others in your industry
- Helps uncover keyword gaps and missed opportunities
- Tracks the impact of your SEO and content marketing efforts
- Guides where to focus next for higher returns
How to Track It:
- Use tools like SEMrush, Ahrefs, or SE Ranking for visibility reporting
- Basic formula: (Your organic traffic ÷ Total traffic for your keyword category) × 100
- Break results down by branded and non-branded keywords
- Track across specific keyword themes or competitor groups
-
Featured Snippet and SERP Feature Wins
These are the results that show up above the regular organic listings. Featured snippets, People Also Ask boxes, image packs, and video carousels can give you top placement even if your page isn’t ranked #1. Winning these spots increases visibility and can drive more traffic by making your listing stand out.
Why it matters:
- Boosts your content’s exposure on high-value keywords
- Brings in more clicks without needing to rank first
- Builds trust and authority in your topic areas
- Helps drive more traffic for informational queries
How to track it:
- Tools like SEMrush, Ahrefs, and SE Ranking help track feature appearances
- Do manual checks to spot feature opportunities in your niche
- Monitor if you retain featured positions after updates
-
Local SEO Rankings (Map Pack, GMB)
Local rankings show where your business appears in Google’s Local Pack and Google Business Profile. These results are often shown above standard search listings and are crucial for businesses with physical locations or local services.
Why it matters:
- Drives local foot traffic and store visits
- Increases leads from “near me” and location-based searches
- Improves your presence in maps and mobile search
- Gives a competitive edge in your service area
How to track it:
- Use geo-grid tools like GMB Radar, Local Falcon, or BrightLocal
- Review Google Business Profile Insights for search queries and actions
- Use Search Console to analyze performance on local terms
- Monitor from different zip codes or neighbourhoods if you serve multiple areas
-
Branded vs. Non-Branded Traffic
This KPI splits your traffic into two groups: people who search for your brand name and those who find you through generic industry terms. Branded traffic usually includes existing customers or people already familiar with your company. Non-branded traffic reflects new visitors who are discovering you through content and SEO.
Why it matters:
- Helps you measure brand awareness over time
- Shows the balance between retention and acquisition
- Lets you refine your content strategy for new and returning users
- Offers insights into campaign success and brand growth
How to track it:
- In Google Analytics 4, use regex filters to create segments for branded vs. non-branded traffic
- In Search Console, filter query data based on brand name or related terms
- Tools like Ahrefs and SEMrush provide branded vs. non-branded keyword breakdowns
- Set separate goals for conversions from both traffic types
-
Backlink Profile Growth
This metric looks at how many new backlinks your website gains over time, along with their quality and diversity. A growing backlink profile signals that your content is earning recognition and that others consider it valuable.
Rather than counting just numbers, modern backlink tracking focuses on the authority and relevance of the domains linking to you.
Why it matters:
- Signals higher authority and trust in your field
- Supports better rankings and organic visibility
- Reflects strong content and outreach performance
- Helps identify which campaigns are earning attention
How to track it:
- Tools like Ahrefs, Moz, and SEMrush provide detailed link tracking
- Use Search Console to see sample backlinks and referring domains
- Track metrics like domain authority, new vs. lost links, and anchor text quality
- Monitor your backlink trends against competitor profiles
-
Domain Authority / Domain Rating
Domain Authority (Moz) and Domain Rating (Ahrefs) are scores that estimate how strong your website’s backlink profile is. While not official Google ranking factors, these metrics help you compare your site’s authority with others in your industry.
These scores are updated regularly and can be used to gauge how well your link-building efforts are going.
Why it matters:
- Helps benchmark your site against top competitors
- Gives a sense of how easily you can rank for competitive keywords
- Guides your SEO strategy and outreach focus
- Tracks the impact of your long-term authority growth
How to track it:
- Use free tools like Moz Domain Analysis or Ahrefs Authority Checker
- For deeper tracking, subscribe to Moz Pro, Ahrefs, or SEMrush
- Track changes monthly and compare with similar websites
- Watch how authority shifts align with traffic or ranking improvements
-
Core Web Vitals / Page Speed
Core Web Vitals are a set of metrics introduced by Google that measure how users experience your website. These include how fast a page loads (LCP), how quickly it responds (INP), and how stable the layout is while loading (CLS). Together, they offer a solid snapshot of your site’s performance from a user’s point of view.
These factors are confirmed Google ranking signals, so staying on top of them is no longer optional. Page speed and user experience now play a major role in visibility and conversions, especially with mobile-first indexing fully in place.
Why it matters:
- Affects your rankings directly, especially on mobile searches
- Impacts bounce rates, session duration, and engagement
- Helps reduce frustration by offering a smoother user experience
- Plays a role in conversion rate and customer trust
How to track it:
- In Google Search Console, use the Core Web Vitals report for real user data
- In PageSpeed Insights, get detailed insights and optimization suggestions
- Use GTmetrix, SpeedVitals, or WebPageTest for continuous performance monitoring
-
Bounce Rate (GA4)
In Google Analytics 4, bounce rate refers to sessions where users didn’t engage meaningfully. These include visits under 10 seconds with no interaction, no events triggered, and fewer than two pageviews. A high bounce rate often signals a disconnect between what users expected and what they found.
This metric helps you spot issues related to content relevance, page design, or user intent mismatches. Lower bounce rates usually suggest more engaged visitors who are exploring your site.
Why it Matters:
- Points out where content might not meet user expectations
- Helps identify poor layout, slow-loading pages, or unclear CTAs
- Signals whether pages are aligned with user intent
- Offers insights for improving on-page engagement
How to Track It:
- In GA4, go to the Engagement reports to find bounce rate data
- Segment by source, landing page, and device to find trends
- Compare organic bounce rate with other channels
- Monitor how changes in content or layout affect bounce rates
-
Average Session Duration
This metric tells you how much time users spend on your site per session. Longer sessions often mean people are finding your content useful and sticking around to read more or explore other pages. It reflects how engaging and easy to navigate your site is.
Session duration varies a lot depending on your industry, but in general, longer times suggest your website is doing a good job of holding interest.
Why it Matters:
- Indicates how valuable and relevant your content is
- Can reflect trust, especially for informational or service sites
- Helps identify which pages keep visitors engaged
- Useful for tracking the impact of content updates or redesigns
How to track it:
- In GA4, use the Engagement section to view average session duration
- Segment by traffic source and device to compare patterns
- Look at specific landing pages and paths that lead to longer sessions
- Benchmark against industry averages to identify gaps
-
Pages per Session
This metric shows how many pages a visitor views during a single session. A higher number means users are exploring your site more deeply. It’s a good signal that your internal linking, content structure, and navigation are working well.
Low numbers might mean visitors aren’t finding what they need, or that your content journey ends too quickly.
Why it matters:
- Reflects how engaging and interconnected your site content is
- Helps measure how well your internal linking strategy is working
- Gives clues about whether visitors are exploring related topics or leaving too soon
- Ties into overall user experience and conversion funnel depth
How to track it:
- In GA4, this metric is less prominent but still available under Engagement
- Use Universal Analytics (if available) for historical comparisons
- You can also calculate it manually: Total pageviews ÷ Total sessions
- Benchmark typical values in your niche (usually between 1.7 and 4.0)
-
AI LLM Traffic (ChatGPT, Perplexity, etc.)
AI LLM traffic includes visits from users who find your content through AI-powered search tools like ChatGPT, Perplexity, Claude, or Google’s AI Overviews. This type of traffic has surged in 2025 as users rely more on these tools for quick answers and trusted content suggestions.
This audience is often more qualified because they are shown your content based on relevance and context, not just keyword matching. It’s also an area where most websites are still not tracking properly, giving early adopters a serious edge.
Why it matters:
- Represents a fast-growing source of high-quality visitors
- Offers exposure to users beyond traditional search engines
- Shows which content is being cited or surfaced by AI tools
- Allows you to measure content authority through AI lens
How to track it:
- In GA4, set up custom referral filters for sources like chat.openai.com, perplexity.ai, claude.ai
- Use tools like Brandwell AI, AuthorityLabs AI, or Previsible to monitor AI visibility
- Track content mentions in AI responses (manually or through AI-SEO platforms)
- Separate LLM traffic from regular search to measure its impact clearly
How to Choose the Right SEO KPIs for Your Business
Here’s how you can figure out which SEO KPIs actually matter for your business:
-
Align KPIs With Overall Business Goals
Start by asking yourself what your business is really trying to achieve. Is it more sales? More signups? More visibility? Your SEO KPIs should reflect those goals clearly. For example, if growth is your main focus, tracking organic traffic and conversions makes sense.
-
Identify the Stage of Your Business (Startup vs. Established)
If you’re a startup, you’ll probably focus on traffic growth and visibility. If your business is already established, you might shift towards tracking conversions, retention, or branded search performance. The stage of your business plays a big role in which KPIs are actually worth your time.
-
Focus on Metrics That Impact Revenue and Conversions
Some metrics look nice on a dashboard but don’t bring in money. Instead of chasing every number, focus on the ones that affect your bottom line. Organic conversion rate, revenue from organic traffic, and lead quality should take priority over vanity metrics like total impressions.
-
Differentiate Between Vanity Metrics and Actionable KPIs
Pageviews, likes, and generic rankings might make your reports look good but don’t always tell you what’s working. Actionable KPIs are the ones that help you make decisions. If you can’t take action based on a number, it probably doesn’t belong on your report.
-
Prioritise a Balanced Mix of Technical, Content, and Off-Page KPIs
Don’t get stuck in one area. A complete SEO strategy covers everything. Track technical KPIs like Core Web Vitals, content KPIs like page engagement or top-performing keywords, and off-page KPIs like backlink growth or referring domains. Keeping a balance helps you see the full picture.
-
Customise KPIs Based on Industry and Target Audience
A local cafe and a B2B SaaS company will need totally different SEO KPIs. Your metrics should match your niche, audience behavior, and typical search journey. Don’t blindly copy what works for another brand.
-
Continuously Review and Adjust KPIs Over Time
Your business goals will change, and your SEO strategy should too. Make it a habit to revisit your KPIs every quarter or so. Drop what’s not useful anymore and bring in new metrics that match where you’re heading.
5 Best Tools to Track SEO KPIs
Tracking the right SEO KPIs requires reliable SEO reporting tools that help you measure rankings, traffic, conversions, and overall performance. Here are the top 5 tools:
-
ViewMetrics
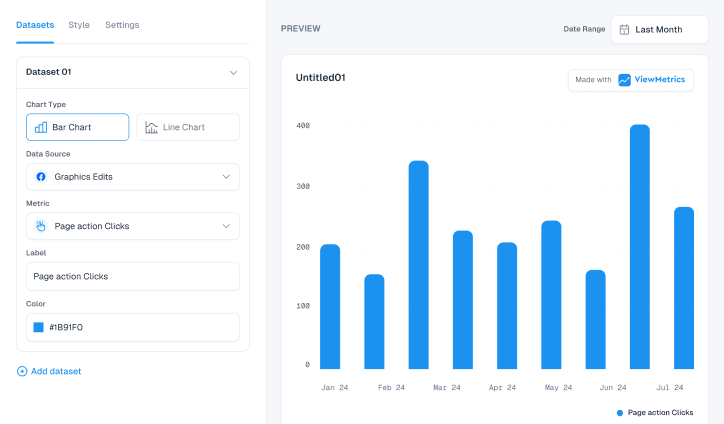
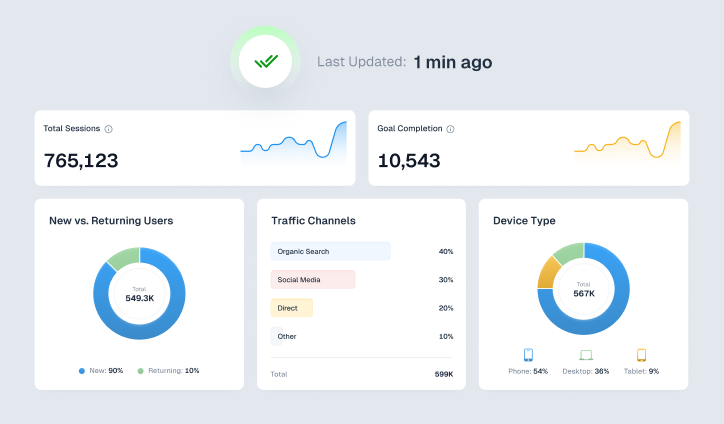
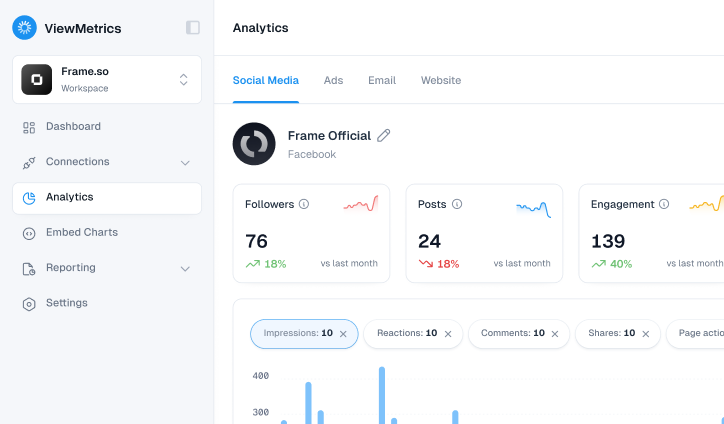
A solid all-in-one tool for monitoring multiple SEO KPIs in one place. Great for marketers who want clean dashboards and easy reporting.
-
Google Analytics
Still the gold standard for tracking user behavior, conversions, and traffic sources. You can build custom reports that align with your SEO goals.
-
SEMrush
A complete SEO toolkit that lets you track keyword rankings, site health, backlinks, and even competitor performance. Ideal for both beginners and pros.
-
Looker Studio
If you love clean dashboards and visuals, this one’s for you. You can connect it to GA4, Google Search Console, or even BigQuery to create fully custom SEO KPI dashboards.
-
AgencyAnalytics
Perfect for agencies managing multiple clients. It combines SEO, PPC, and web data in one neat report. You can schedule automated reports and easily highlight SEO wins.
View All Your Marketing and Website Data - Instantly
Connect Instagram, Mailchimp, Google Analytics & more
Pre-built dashboards, no setup needed
Save hours on reporting every week
Closing Thoughts
SEO is not just about publishing content and hoping for the best. The real progress shows when you track the right numbers and make sense of them. The KPIs we covered give you a way to see where your site stands and what needs attention. Start simple, choose a few metrics that match your business goals, and build from there. With steady tracking and small adjustments, you’ll have a clearer picture of how your SEO is shaping your growth.
Frequently Asked Questions
What are the most important SEO KPIs to track in 2025?
Some of the most useful SEO KPIs to watch include organic traffic, conversion rate, SEO ROI, keyword rankings, click-through rate, and Core Web Vitals. These help show both performance and user experience.
Which SEO KPIs should agencies focus on?
Agencies should focus on KPIs like organic traffic, keyword rankings, conversions, and ROI. They should also keep an eye on local SEO performance and featured snippet visibility, especially for client reports.
What are technical SEO KPIs?
Technical SEO KPIs usually include page speed, Core Web Vitals, mobile usability, crawl issues, and the number of pages properly indexed. They reflect how search engines and users experience your site.
How often should SEO KPIs be tracked?
Some metrics like traffic and rankings can be checked daily, but most teams review all SEO KPIs on a weekly or monthly basis for trends and planning.
What is the difference between SEO KPIs and SEO metrics?
SEO metrics are raw numbers like impressions or backlinks. KPIs are specific metrics tied to business goals like sales, signups, or overall traffic growth.
Which tools are best for tracking SEO KPIs?
Popular tools include ViewMetrics, Google Analytics, SEMrush, Looker Studio, and AgencyAnalytics. These help track, compare, and report your SEO performance.
Do SEO KPIs change over time?
Yes. As your business grows and search engines update their systems, your KPIs should be reviewed and adjusted to stay useful and focused.

