
Tracking the Cost Per Conversion helps you understand how much money you’re spending to get each customer to take action, whether it’s signing up, making a purchase, or filling out a form. This metric shows how efficiently your marketing budget is being used and gives you a solid way to compare campaigns. In this guide, we’ll explain what Cost Per Conversion means, how to calculate it, and share a few tips to help you lower it over time. Let’s get started.
What is Cost Per Conversion?
Cost Per Conversion (or Cost Per Acquisition, CPA) is a digital marketing metric that measures the average cost of generating one desired action (e.g., purchase, sign-up, or form submission). It is calculated by dividing total advertising spend by the number of conversions, allowing marketers to evaluate campaign efficiency.
Why Cost Per Conversion Matters
Cost per conversion is one of the most useful metrics for evaluating how well your marketing campaigns are working. Here’s why it matters:
-
Shows Campaign Efficiency
It tells you how much you’re spending to get one customer or lead. This helps you see if your ad budget is being used wisely.
-
Helps Compare Channels
Whether you’re using Google Ads, Facebook, or email campaigns, comparing their cost per conversion shows you which one gives you better results.
-
Supports Smarter Budget Decisions
Knowing the cost per conversion lets you invest more in what’s working and reduce spending on what’s not.
-
Reveals Campaign Waste
A high cost per conversion may mean poor targeting or weak messaging. This helps you quickly spot issues and make changes.
-
Affects ROI and Customer Acquisition Cost (CAC)
Lowering your cost per conversion directly improves your return on investment and reduces the cost of acquiring each customer.
How to Calculate Cost Per Conversion?
The formula for calculating cost per conversion is simple:
Cost Per Conversion = Total Advertising Costs / Number of Successful Conversions
You just divide the total amount spent on a campaign by the number of conversions it generated. For example, if you spent $1,000 and got 100 conversions, your cost per conversion would be $10.
This number gives you a direct look at how much each action is costing you, and helps you understand if your campaign is worth the investment.
Cost Per Conversion in Various Platforms
Cost per conversion changes from platform to platform depending on your audience and ad format. Here’s a quick look at how each one compares.
-
Google Ads (Search)
Google Search Ads usually give you strong results because they reach people who are already searching for your product or service. These are users with clear intent, which means they are more likely to convert. Because of that, the cost per conversion tends to be higher compared to other platforms. Still, many marketers find the higher cost worth it because of the quality of leads.
Typical Cost Per Conversion Range: $5 to $25+
Good For: High-intent, bottom-of-funnel traffic
-
Google Display Ads
With Display Ads, your message shows up on websites, apps, and YouTube videos. These ads reach people earlier in their journey, so conversion rates tend to be lower than search ads. But if you use eye-catching visuals and smart targeting, they can still deliver good results, especially for remarketing.
Typical Cost Per Conversion Range: $8 to $35
Good For: Remarketing, brand awareness, top-of-funnel traffic
-
Meta Ads (Facebook & Instagram)
Facebook and Instagram give you access to highly detailed audience targeting. With the right visuals and messaging, you can get great conversions at low cost. The platform works especially well for D2C brands and lead generation. But results can vary depending on how well you match your ad creative to your audience.
Typical Cost Per Conversion Range: $2 to $15
Good For: D2C brands, lead generation, e-commerce
-
LinkedIn Ads
LinkedIn Ads usually have a much higher cost per conversion compared to other platforms. That’s because you’re targeting professionals, job titles, industries, or even specific companies. This makes the platform valuable for B2B and high-ticket services, but not ideal if your budget is tight or you’re targeting everyday consumers.
Typical Cost Per Conversion Range: $30 to $100
Good For: B2B lead generation, recruiting, high-ticket sales
-
TikTok Ads
TikTok Ads work best when your content is creative and blends in with the platform’s fun, fast-paced vibe. The cost per conversion is usually on the lower side, especially for app downloads or products that appeal to younger audiences. If your video grabs attention quickly, you can see strong results even with a modest budget.
Typical Cost Per Conversion Range: $1 to $10
Good For: Gen Z targeting, viral content, app downloads
-
YouTube Ads
YouTube Ads let you combine video storytelling with audience targeting. Conversion costs here can vary a lot. If your video is long or doesn’t get to the point quickly, people might skip it or lose interest. But if it’s engaging and clear, YouTube can bring in quality leads, especially for products that need more explanation.
Typical Cost Per Conversion Range: $4 to $18
Good For: Brand awareness, product explainers, long-form storytelling
-
Microsoft Ads (Bing Ads)
Microsoft Ads often fly under the radar, but they offer good cost per conversion, especially in regions like the US where Bing has a steady user base. The platform usually has less competition, which means lower costs. It’s a solid choice if your target audience includes older users or desktop-heavy traffic.
Typical Cost Per Conversion Range: $3 to $12
Good For: Low-competition niches, desktop-heavy audiences, older user base
What Is a Good Cost Per Conversion?
A good cost per conversion is one that stays within your profit margin and delivers a strong return on ad spend (ROAS). For example, if you’re selling a $100 product and your profit after costs is $40, then a $10 to $20 cost per conversion is considered good because you’re still making a reasonable profit per sale. What’s considered “good” also depends on your industry. In e-commerce or SaaS, a good cost per conversion might fall between $5 and $30. In high-ticket services like legal or real estate, $100 to $200 might still be acceptable if the client’s lifetime value is high.
Let’s say you’re running Google Ads for a skincare brand. If you’re spending $200 and getting 20 conversions, your cost per conversion is $10. If each customer buys a $50 product and has a 30% repeat purchase rate, that $10 spend is well worth it. In this case, your cost per conversion is good because it supports long-term growth while still staying profitable.
What Is a Bad Cost Per Conversion?
A bad cost per conversion means you are spending too much to get someone to convert, and it’s cutting into or completely wiping out your profits. For instance, if your product sells for $50 and you’re spending $60 to acquire one customer, that’s a clear loss unless your customer makes multiple purchases over time. Even if your sales cover ad spend, a high cost per conversion may still be bad if it doesn’t leave enough margin to scale or reinvest in your business.
Imagine a situation where you’re promoting a $20 digital course but spending $35 in ads to get one buyer. Even if you’re getting conversions, you’re operating at a loss. This might happen due to targeting the wrong audience, using ineffective ad creatives, or bidding too high on keywords. In such cases, the cost per conversion needs to be lowered through optimisation, or the campaign risks becoming unsustainable.
How to Set Cost Per Conversion Benchmarks and Goals
Setting the right cost per conversion benchmarks is important if you want your campaigns to stay profitable and scalable. Here’s how to do it step by step:
-
Define What Counts as a Conversion
Start by clearly defining what a conversion means for your business. For some, it’s a product purchase. For others, it could be a lead form submission, app download, or booking. Your definition sets the stage for measuring success.
-
Calculate Your Break-Even Cost Per Conversion
Figure out the highest amount you can afford to pay for a conversion without losing money. If your product sells for $12 and your profit margin is 40 percent, you should not spend more than $4.80 to get a sale. This break-even point helps set boundaries.
-
Use LTV, Not Just AOV, to Set Realistic CPA Targets
Instead of only looking at the average order value, factor in customer lifetime value (LTV). A customer might only spend $80 today but could spend $800 over a year. That makes it worth spending more upfront to acquire them.
-
Start With Historical Data
Look at your past campaigns to see what your average cost per conversion has been so far. This gives you a baseline. Use that data to spot trends and set realistic goals based on actual performance, not just guesses.
-
Segment Benchmarks by Channel and Campaign Type
Cost per conversion often varies between channels. Paid search, social ads, retargeting, and branded campaigns all behave differently. Create separate benchmarks for each type so you don’t compare apples to oranges.
-
Set a Target Range Instead of One Fixed Number
Aim for a flexible range instead of a single number. For example, target $3 to $4.25 instead of just $3.50. This gives your campaigns some breathing room to test and scale while staying within budget.
-
Track, Review, and Adjust Regularly
Check in on your cost per conversion weekly or monthly. As your funnel improves, or as new offers roll out, your benchmarks will shift. Keep adjusting to match your actual performance and business goals.
How to Improve Your Cost Per Conversion
If your cost per conversion is too high, don’t panic. There are practical ways to bring it down and make your ad spend work better. Here’s how you can improve your results:
-
Fix Conversion Tracking and Attribution
Before anything else, make sure your conversion tracking is accurate. Wrong data leads to bad decisions. Fix any tag errors, pixel mismatches, or double-counting issues. Get clarity on which campaigns are driving actual results.
-
Improve Landing Page Conversion Rates
Even great ads won’t help if the landing page doesn’t convert. Check your page speed, form length, CTAs, and design. Small changes like clearer copy or faster load times can reduce drop-offs and bring down your cost per conversion.
-
Refine Targeting to Focus on High-Intent Audiences
Look at your audience filters. Are you showing ads to people who actually need your product? Tighten targeting to focus on users who are more likely to convert. This includes repeat website visitors, lookalike audiences, or users with past cart activity.
-
Optimize Keywords and Add Negative Keywords
For search campaigns, revisit your keywords. Remove the ones with low intent or poor results. Add negative keywords to block irrelevant traffic. This saves money and ensures your budget goes to searchers who are more likely to convert.
-
Improve Ad Creative and Copy
Your ad needs to speak clearly and offer something valuable. Test new headlines, visuals, and CTAs. Highlight your unique selling point and address your audience’s biggest problem. Better creatives drive more clicks and conversions.
-
Use Retargeting to Convert Warm Leads
Retargeting helps you reach people who already interacted with your brand. These users are cheaper to convert. Set up retargeting ads for website visitors, video viewers, or abandoned cart users to bring down your average cost per conversion.
-
Test Offers, CTAs, and Funnels Regularly
Sometimes the issue is not your ad or your audience. It could be your offer. Try different hooks, calls to action, and user flows. Even small changes in your funnel can lead to lower costs. Keep testing until you find what consistently works.
Common Mistakes When Managing Cost Per Conversion
Even if you’re tracking your CPA and running campaigns regularly, certain mistakes can throw off your data and waste your budget. Here are some of the most common ones to avoid:
-
Incorrect Conversion Tracking Setup
Many advertisers set up tracking incorrectly. They either double count conversions, miss tracking important events, or track the wrong ones. This leads to bad data, which means you’re optimising based on false numbers.
-
Optimizing for the Wrong Conversion Action
Sometimes campaigns are set to optimise for soft goals like page views or add-to-carts instead of real conversions like purchases or leads. This might show better performance on paper, but it doesn’t help the business grow.
-
Mixing Different Conversion Types in One CPA
If you’re combining lead submissions, product sales, and free trial signups under one cost per conversion figure, the result becomes meaningless. Each conversion type has a different value and should be tracked separately.
-
Ignoring Lead Quality
Getting more leads doesn’t always mean better results. If your form fills are low-quality or not converting into paying customers, you’re just wasting budget. It’s better to get fewer but higher-intent leads, even if the cost per lead goes up slightly. Always balance quantity with quality.
-
Not Separating Branded vs Non-Branded Campaigns
Branded campaigns usually have a much lower CPA than non-branded ones. If you mix both together in your reports, the average looks better than it really is. Keep them separate so you can set more realistic benchmarks and make smarter decisions.
-
Making Decisions With Too Little Data
Rushing to judge a campaign with just a few days of data or a small number of conversions can lead to wrong decisions. Let your campaigns run long enough to collect statistically meaningful data before pausing, scaling, or adjusting.
-
Trying to Fix CPA Only Through Ads
Many marketers keep changing their ad creatives or headlines while ignoring the bigger picture. In reality, your landing page, offer, or funnel might be the real problem. Without testing and improving those parts, ad tweaks alone won’t help lower your CPA.
See the Real Cost Per Conversion with ViewMetrics
If you’re running ads across Google, Meta, LinkedIn, and other platforms, it’s tough to figure out your actual cost per conversion. Each platform gives you its own numbers, and trying to combine them often means exporting everything to spreadsheets or setting up complicated dashboards.
ViewMetrics fixes that by bringing all your ad spend and conversion data into one simple view. It connects to Google Ads, Meta, LinkedIn, and more, then pulls your spend, clicks, conversions, and revenue into a single dashboard. Once that’s done, it calculates your blended cost per conversion across all channels.
This gives you a clear picture of what each lead or sale is actually costing you when you look at your total budget. You can break it down by channel, campaign, or account to see where the money is working and where it’s not.
For example, you can compare your overall Google + Meta + LinkedIn cost per conversion to your targets. If one platform is pushing your blended average up, you’ll see it right away. And if shifting part of your budget to another platform could give you better conversions for less, ViewMetrics makes that obvious too.
No more guesswork or copy-pasting from different reports. Just one dashboard that shows what’s really going on with your performance.


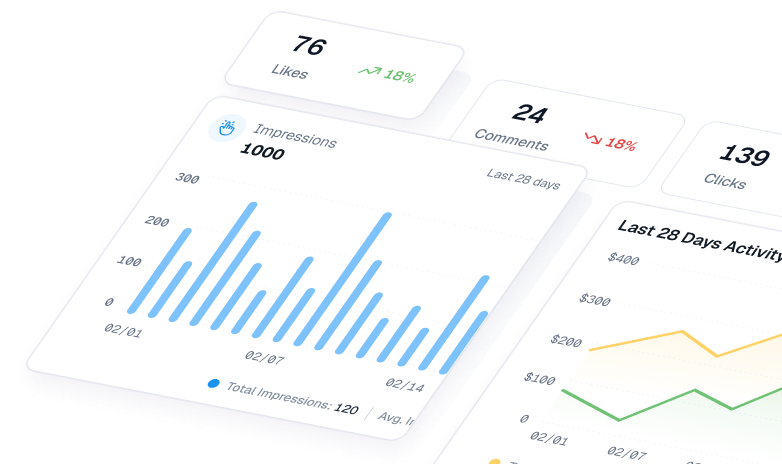
View All Your Marketing and Website Data - Instantly
 Connect Instagram, Mailchimp, Google Analytics & more
- Pre-built dashboards, no setup needed
- Save hours on reporting every week
Closing Thoughts
Cost Per Conversion tells you one simple truth. Are your ads actually paying off? When you track it properly and keep improving the basics like targeting, creatives, and landing pages, you spend less to get better results. Treat it as a regular check for your campaigns and you’ll stay in control of both performance and budget.
Frequently Asked Questions (FAQs)
-
What is the cost per conversion formula?
Cost per conversion = Total ad spend ÷ Number of conversions.
It tells you how much you’re spending to get one customer to take a specific action.
-
What affects average cost per conversion?
Many things affect it, like ad quality, competition, bidding strategy, landing page experience, and targeting. Poorly optimized campaigns usually cost more.
-
What is cost per conversion in Google Ads?
In Google Ads, it’s the average amount you spend to get one conversion, like a sale, sign-up, or lead. It’s tracked inside your campaign reports.
-
Why is my cost per conversion increasing?
It can go up due to rising competition, weak ad relevance, low-quality traffic, or poorly performing landing pages.
-
How to decrease cost per conversion?
Improve ad copy, use better targeting, test landing pages, refine keywords, and pause low-performing ads. Track your data closely to spot what’s working.


