Key Takeaways: Best PPC KPIs
- PPC KPIs tell you how well your ads perform across clicks, costs, and conversions.
- The top KPIs for PPC include CTR, CPC, CPA, ROAS, and LTV.
- Tracking these important PPC campaign KPIs helps you improve efficiency and ROI.
- Use ViewMetrics to visualize, automate, and integrate your performance data in real-time.
- Regularly monitoring which PPC KPIs to track ensures your ad dollars deliver results, not regrets.
If you’ve ever run an important PPC campaign, you probably know that gut feeling, you launch an ad, watch the clicks roll in, and think, “Alright, this looks good.” But the sales stay flat. Frustrating, right? That’s the tricky part about paid ads: the numbers might look great on the surface, but they don’t always tell the full story.
That’s why understanding your PPC KPIs is such a game-changer. These are the numbers that cut through the noise. They actually tell you if your campaign is working or just burning through budget.
What are PPC KPIs?
In simple terms, PPC (Pay-Per-Click) KPIs are the metrics that show you how well your paid ads are doing. They measure your clicks, conversions, and cost-efficiency, helping you spot what’s actually worth your ad spend.
Think of them as your campaign’s health report. They tell you what’s thriving, what’s struggling, and what needs fixing. Tracking these KPIs for PPC means you don’t need to guess anymore. Instead, you can make data-driven decisions about your ad copy, target audience, and budget.


View All Your Marketing and Website Data - Instantly
 Connect Instagram, Mailchimp, Google Analytics & more
- Pre-built dashboards, no setup needed
- Save hours on reporting every week
Also read: What are Advertising Insights
10 Best PPC KPIs to Measure Your Paid Campaign Success
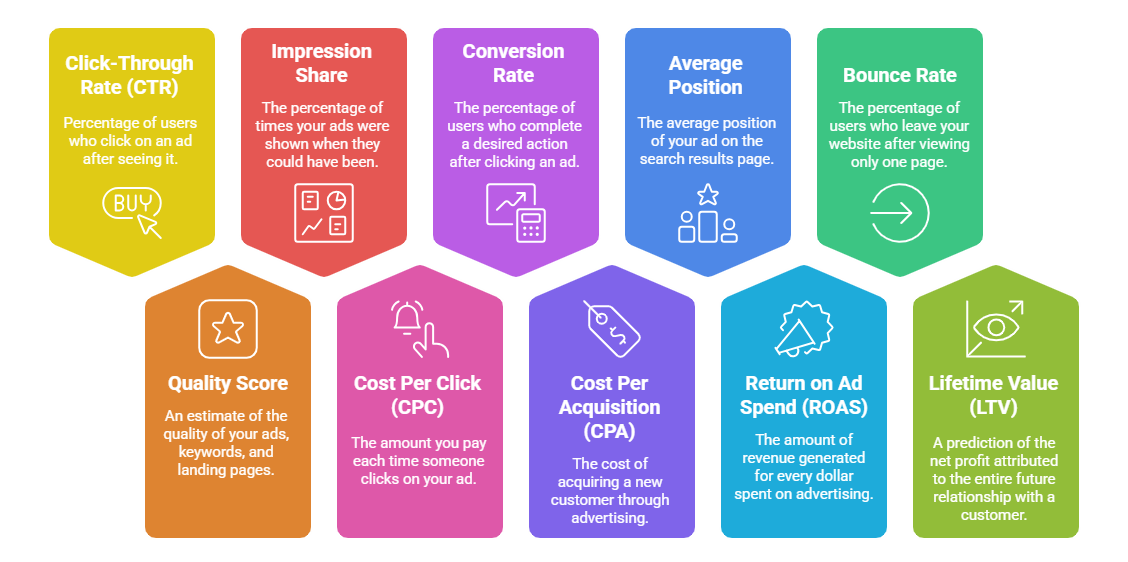
Let’s talk about the most important PPC campaign KPIs you should keep an eye on, and why they matter more than you think.
-
Click-Through Rate (CTR)
Imagine walking past a store and actually stopping to check it out. That’s what a click-through represents in digital terms.
- What is CTR?
It’s the percentage of people who saw your ad and clicked it. - How to Calculate:
CTR = (Clicks ÷ Impressions) × 100 - Why it Matters:
A strong CTR shows that your ad’s headline or offer resonates with your audience. It means people find it interesting enough to learn more. - What’s a Good CTR?
Usually, anything above 2% is decent, but it depends on your industry. For competitive spaces, even a 1% CTR can mean big success.
- What is CTR?
-
The Quality Score
Your Quality score is basically Google’s way of saying, “Hey, your ad is relevant, we like it.”
- What is it?
It’s a score between 1 and 10 that evaluates your ad’s relevance and landing page quality. - How it’s Calculated:
Google looks at your CTR, keyword relevance, and landing page experience. - Why it Matters:
The higher your Quality Score, the less you pay per click. It’s that simple. Google rewards ads that serve users better. - What’s a Good One?
A score of seven or higher keeps your costs low and placement strong.
- What is it?
-
Impression Share
Ever felt like your ad is lost in a sea of competitors? Impression Share tells you exactly how often your ad shows up compared to everyone else.
- What is it?
It’s the percentage of impressions your ad gets out of all possible ones. - Formula:
Impression Share = (Your Impressions ÷ Total Eligible Impressions) × 100 - Why it Matters:
If your share is low, you can lose visibility, maybe to bigger budgets or better bids. - What’s Good?
Try to keep it above 60% to stay competitive.
- What is it?
Also Read: Difference Between Reach vs Impressions
-
Cost Per Click (CPC)
CPC is like your campaign’s price tag per visitor.
- What is CPC?
It’s how much you pay every time someone clicks on your ad. - How to Calculate:
CPC = Total Cost ÷ Total Clicks - Why it Matters:
Lower CPC means you’re spending efficiently. It tells you how far your budget stretches per engagement. - What’s a Good CPC?
It varies widely, but ideally, it should align with your target Cost Per Acquisition (CPA).
- What is CPC?
-
Conversion Rate
Now is the time to talk about one of the most important PPC campaign KPIs that shows real results.
- What is Conversion Rate?
It’s the percentage of users who clicked your ad and took the action you wanted, maybe a signup, purchase, or demo request. - How to Calculate:
Conversion Rate = (Conversions ÷ Clicks) × 100 - Why it Matters:
It shows how well your landing page and offer close the deal. High traffic means nothing if no one converts. - What’s a Good Rate?
Usually 2-5%, though in some niches even 1% can be profitable.
- What is Conversion Rate?
-
Cost Per Acquisition (CPA)
If CTR is about attention, CPA is about results.
- What is CPA?
It tells you how much it costs to acquire one paying customer. - Formula:
CPA = Total Ad Spend ÷ Conversions - Why it Matters:
It’s one of the most telling KPIs for PPC strategy because it reveals whether your ads are profitable. - What’s a Good CPA?
Ideally, your CPA should be well below your profit margin.
- What is CPA?
-
Average Position
Back in the day, this metric told you where your ad appeared in search results. While Google has since phased out its exact position reporting, the idea remains the same: visibility counts.
- Why it Matters:
Higher visibility often means more clicks and awareness, though sometimes it comes at a higher cost. - What’s Ideal?
Ads that consistently appear in the top 3 positions tend to perform best.
- Why it Matters:
-
Return on Ad Spend (ROAS)
This is the big one. It’s the PPC KPI that ties your results directly to revenue.
- What is ROAS?
It measures how much money you earn for every dollar you spend on ads. - Formula:
ROAS = Revenue ÷ Ad Spend - Why it Matters:
A good ROAS means your campaigns aren’t just breaking even. They are driving profit. - What’s a Good ROAS?
Most businesses aim for at least a 4:1 ratio. It simply means you earn $4 for every $1 spent.
- What is ROAS?
-
Bounce Rate
You know that awkward moment when someone clicks your ad, lands on your page, and immediately leaves? That’s a bounce.
- What is a Bounce Rate?
It’s the percentage of visitors who leave your site without taking action. - How to Calculate:
Bounce Rate = (Single-Page Visits ÷ Total Visits) × 100 - Why it Matters:
A high bounce rate often signals a mismatch between your ad and your landing page content. - What’s Good?
Below 50% is solid. Above 70%? Time for a landing page refresh.
- What is a Bounce Rate?
-
Lifetime Value (LTV)
Finally, let’s look at the long game.
- What is LTV?
It’s the total revenue a customer brings to your business over time. - Formula:
LTV = Average Purchase Value × Purchase Frequency × Customer Lifespan - Why it Matters:
When you know your LTV, you can spend confidently on acquisition, because you understand the payoff. - What’s a Good LTV?
A healthy ratio is 3:1 or higher compared to your CPA.
- What is LTV?
Read Related: The SEM Tracking Blueprint
How to Track PPC KPIs in ViewMetrics
Do you often find yourself buried under spreadsheets, hopping between tabs, and wondering which PPC KPI to track next? That’s exactly where ViewMetrics steps in to make life easier. It transforms the usual chaos of campaign tracking into clear, visual insights that actually make sense.
You don’t need to be a data expert to understand what’s working and what’s not! Everything is right there, simple and visual. Just keep these points in mind
-
Set Clear and Actionable Goals
Before diving into data, it’s important to know what success looks like. ViewMetrics helps you create SMART goals that are Specific, Measurable, Achievable, Relevant, and Time-bound.
Instead of vague targets like “get more clicks,” set a defined goal such as “increase CTR by 10% this quarter.” This helps you stay focused and measure progress more meaningfully.
-
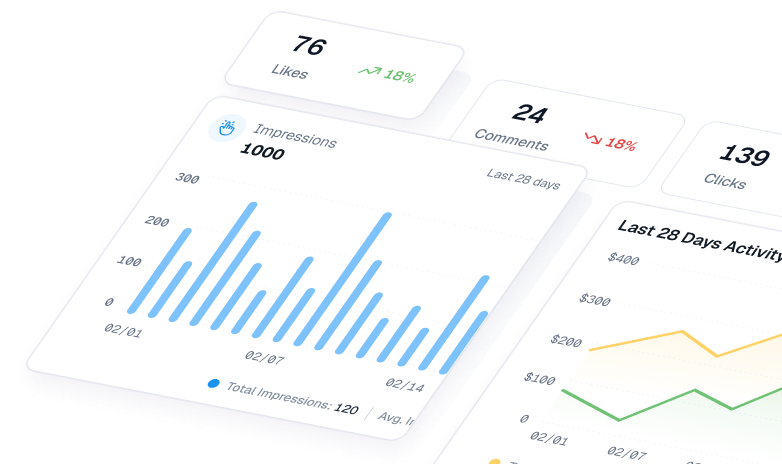
Monitor All Key PPC Metrics in Real Time
With ViewMetrics, you can view all your PPC KPIs in one clean, easy-to-read dashboard. You don’t have to jump between platforms or manually pull reports. It gives you a visual snapshot of performance. You can instantly see which campaigns are performing well and which ones need more attention.
-
Automate Your Reports Effortlessly
No more manual exports or number crunching at the end of every week! ViewMetrics automatically gathers your essential metrics and turns them into clear, visual summaries. You can schedule automated reports to arrive in your inbox. They keep you updated without the extra work.
-
Connect All Your Ad Accounts in One Place
One of the best things about ViewMetrics is its ability to integrate with multiple ad platforms. Whether you are running campaigns on Google Ads, Facebook, or LinkedIn, everything can be connected to a single dashboard. This gives you a 360° view of your marketing performance.
This feature also helps you understand which channels drive the best results and where your budget delivers the most impact.
At the end of the day, data doesn’t just tell you what’s happening. It shows you why. When you start tracking your PPC KPIs, you begin to see patterns, not just numbers. Maybe your CTR is strong, but your bounce rate is high. Or your CPC is great, but your ROAS is lagging.
That’s the magic of understanding these KPIs. It gives you control!
So, next time you launch a campaign, don’t just hope it performs. Measure, adjust, and let your data do the talking.