Destinations
Connect your marketing data to ViewMetrics and seamlessly sync it with your favorite presentation or project management tools. Automate your reporting or build custom dashboards with charts that update daily. Select a destination below to explore how it works.
Google Products
Slides
Google Sheets
Don’t just take our word for it

ViewMetrics’ social analytics tool has provided great insights into social channels for our clients and has become an integral part of our content marketing strategies.
Frequently asked questions
Work smarter by automating client reports now
Get Started for Free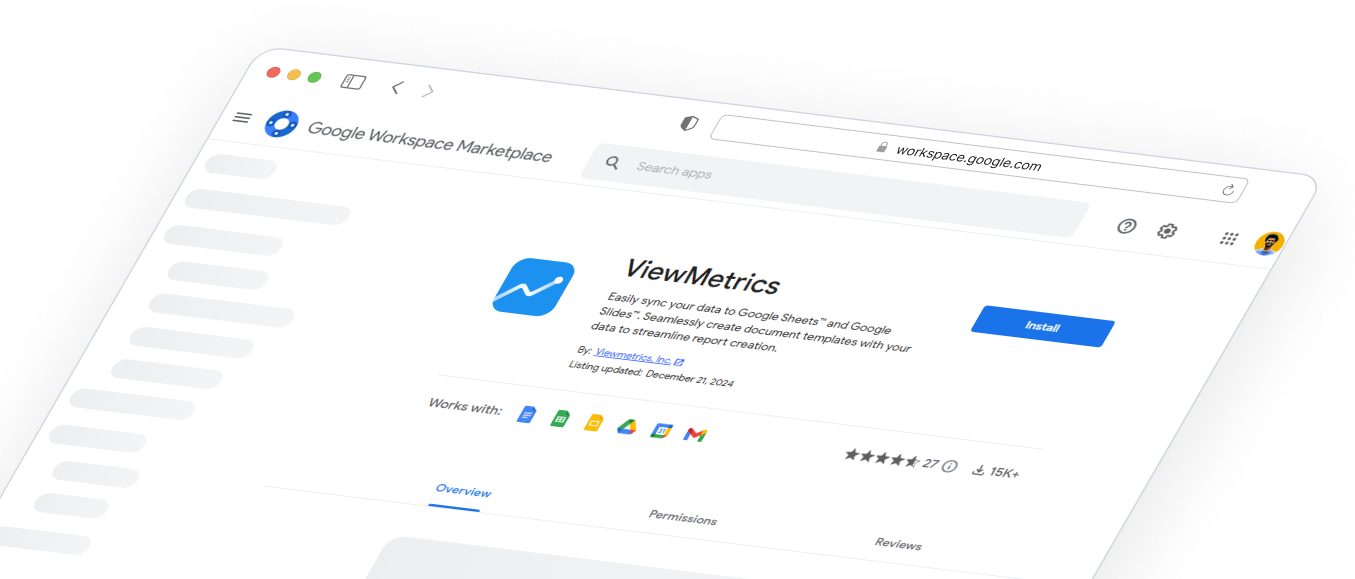
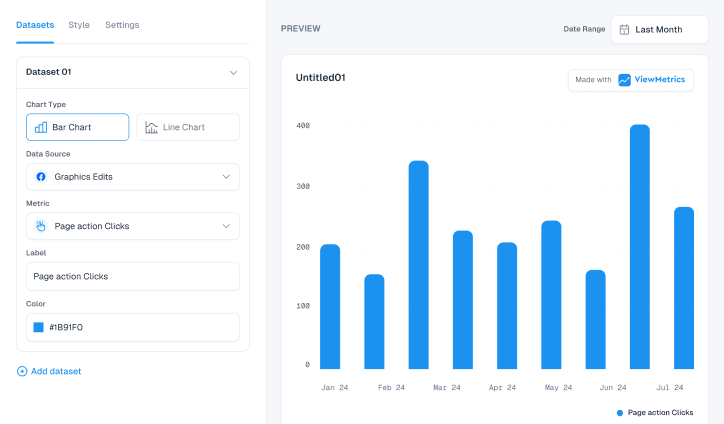
Design That Stands Out
Elevate visuals effortlessly with customizable styling options tailored to match brand aesthetics.
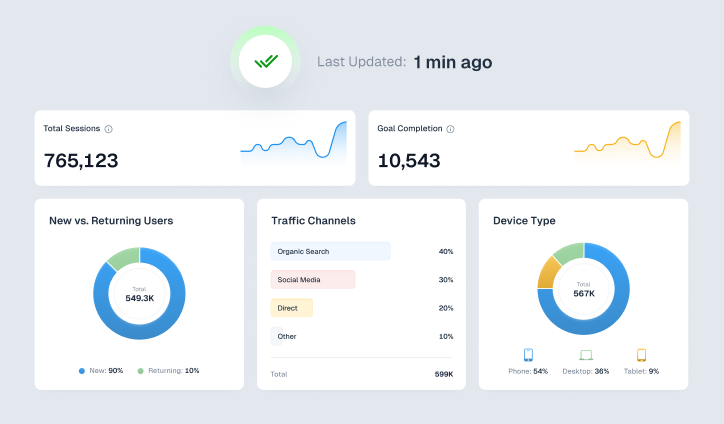
Effortless Data Syncing
Keep insights up-to-date with seamless and flexible data synchronization across platforms.
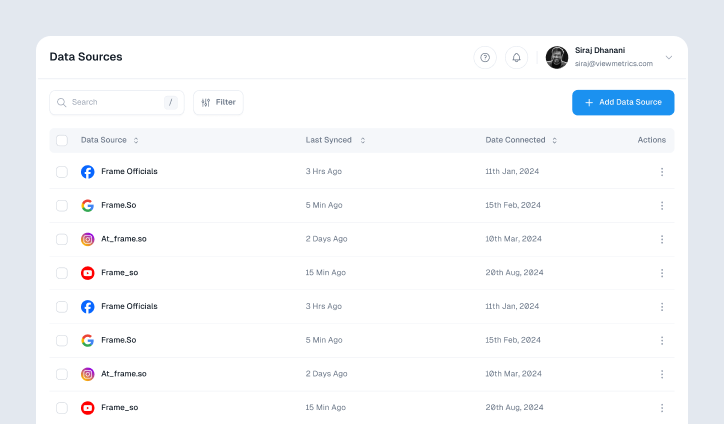
Connect with Ease
Integrate effortlessly with leading platforms to streamline workflows and maximize efficiency.
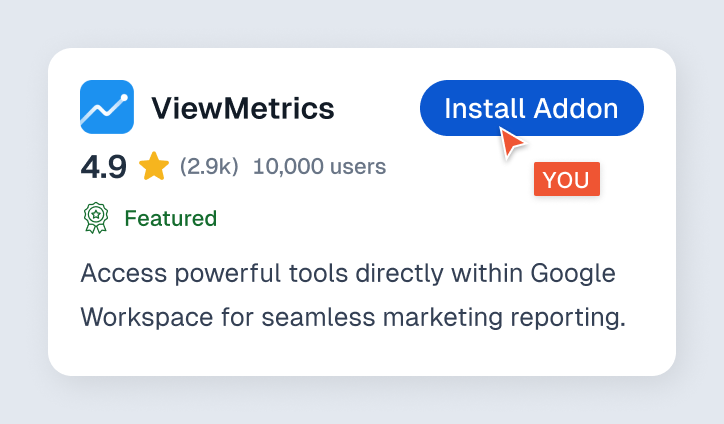
Boost Productivity with Google Add-On
Access powerful tools directly within Google Workspace for seamless marketing reporting.
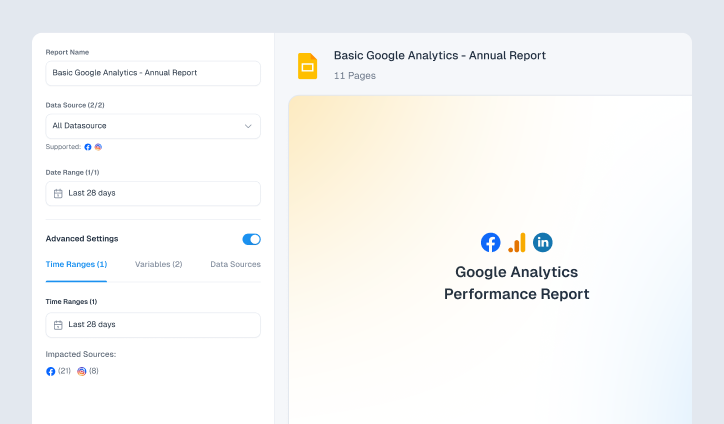
Custom Reports, Instant Insights
Generate tailored marketing reports effortlessly, delivering key insights in just a few clicks.
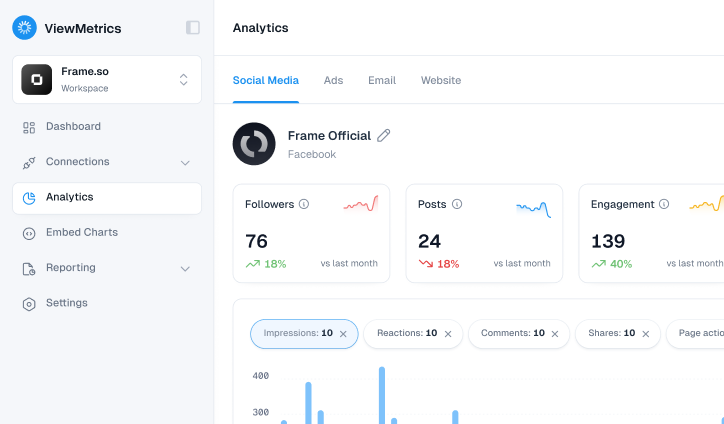
Actionable Analytics at a Glance
Access in-depth analytics to uncover trends, optimize strategies, and drive impactful decisions.
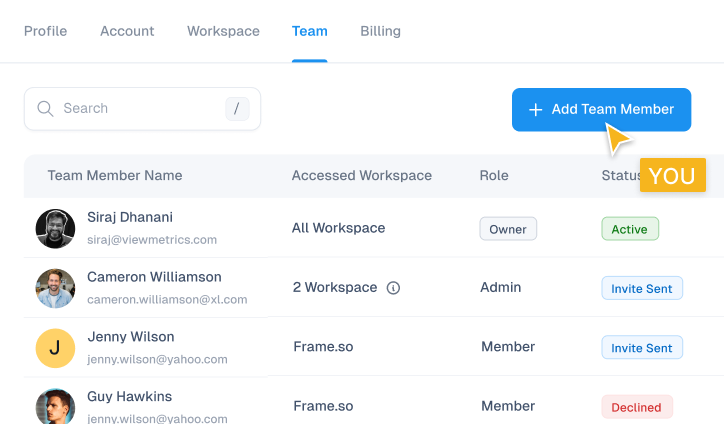
Collaborate with Ease
Invite team members to share insights, streamline workflows, and work together seamlessly.

Design That Stands Out
Elevate visuals effortlessly with customizable styling options tailored to match brand aesthetics.

Effortless Data Syncing
Keep insights up-to-date with seamless and flexible data synchronization across platforms.

Connect with Ease
Integrate effortlessly with leading platforms to streamline workflows and maximize efficiency.

Boost Productivity with Google Add-On
Access powerful tools directly within Google Workspace for seamless marketing reporting.

Custom Reports, Instant Insights
Generate tailored marketing reports effortlessly, delivering key insights in just a few clicks.

Actionable Analytics at a Glance
Access in-depth analytics to uncover trends, optimize strategies, and drive impactful decisions.

Collaborate with Ease
Invite team members to share insights, streamline workflows, and work together seamlessly.

Design That Stands Out
Elevate visuals effortlessly with customizable styling options tailored to match brand aesthetics.

Effortless Data Syncing
Keep insights up-to-date with seamless and flexible data synchronization across platforms.

Connect with Ease
Integrate effortlessly with leading platforms to streamline workflows and maximize efficiency.

Boost Productivity with Google Add-On
Access powerful tools directly within Google Workspace for seamless marketing reporting.

Custom Reports, Instant Insights
Generate tailored marketing reports effortlessly, delivering key insights in just a few clicks.

Actionable Analytics at a Glance
Access in-depth analytics to uncover trends, optimize strategies, and drive impactful decisions.

Collaborate with Ease
Invite team members to share insights, streamline workflows, and work together seamlessly.