Summary for the Blog
- Google Looker Studio is a solid free option for basic dashboards, but it can fall short on advanced features, automation, and flexibility.
- Top alternatives like ViewMetrics, Tableau, Power BI, Qlik, ThoughtSpot, and Zoho Analytics offer stronger customization, better integrations, and smoother reporting experiences.
- The best choice depends on your goals, technical skills, and budget, so explore each option’s features before making the switch.
Google Looker Studio has been a popular go-to for data visualization and reporting, especially for people looking for a free, easy-to-use dashboard tool. But let’s be honest. It doesn’t always hit the mark when it comes to advanced features, custom reporting, or automation. If you’ve found yourself wanting something more flexible, powerful, or better suited for your business needs, you’re not alone.
This guide walks you through some of the top alternatives to Looker Studio. Whether you’re looking for easier client reporting, deeper analytics, or just a smoother user experience, each option below has something unique to offer. From budget-friendly picks to full-blown enterprise solutions, there’s something here for every kind of user.
Let’s start with a quick overview of the list.
Best Alternatives to Looker Studio
| Tool | Best For | Ease of Use | Custom Dashboards | Data Sources Integration | Pricing (Starting) | Unique Selling Point |
|---|---|---|---|---|---|---|
| ViewMetrics | Marketing agencies, freelancers | ★★★★★ | Yes | Yes Google, Meta, more | Free plan + Paid tiers | Built for marketing reporting, auto-ready templates |
| Tableau | Enterprise-grade data visualization | ★★★★☆ | Yes | Yes 100+ connectors | Starts from $15 | Powerful visual analytics & storytelling |
| Power BI | Microsoft ecosystem users | ★★★★☆ | Yes | Yes Excel, Azure, etc. | Starts from $10 | Affordable and integrates tightly with MS tools |
| SAP Data Intelligence Cloud | Large-scale enterprise data orchestration | ★★☆☆☆ | Yes | Yes SAP & non-SAP systems | Custom quote | End-to-end data lifecycle management |
| Google Analytics 360 | Advanced web and app analytics | ★★★☆☆ | Limited | Yes Google ecosystem | Starts around $50,000 annually | Enterprise-grade GA with SLA and integrations |
| Qlik | Associative data exploration | ★★★★☆ | Yes | Yes 100+ sources | Starts from $30 | Associative engine for in-depth insights |
| Sisense | Embedded analytics & BI for apps | ★★★★☆ | Yes | Yes APIs + DBs | Custom quote | Great for product teams embedding dashboards |
| ThoughtSpot | Search-driven analytics | ★★★★☆ | Yes | Yes Cloud + SaaS sources | Starts from $50 | Natural language queries for insights |
| Databox | KPI tracking for marketers & execs | ★★★★★ | Yes | Yes 70+ native connectors | Free + $159/month | Mobile-first, preset templates, goal tracking |
| Zoho Analytics | SMBs and teams using the Zoho ecosystem | ★★★★☆ | Yes | Yes 500+ integrations | Starts at $25/month | Affordable, integrates seamlessly with Zoho & more |
-
ViewMetrics(The Best Choice for Marketing Agencies)

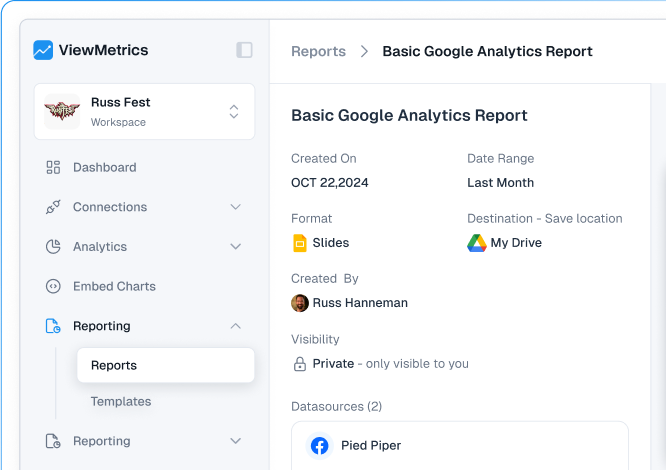
If you’re tired of juggling between multiple tools to create marketing reports, ViewMetrics might just be the upgrade you need. It’s built with marketers in mind, especially agencies and consultants who deal with multiple clients and platforms. Instead of switching between tabs, downloading CSVs, and manually building reports, ViewMetrics brings all your data together into one smart, easy-to-use system.The platform connects with almost every major marketing platform you can think of, including Facebook Ads, Google Ads, LinkedIn, Instagram, Mailchimp, YouTube, and more. Once your data is in, you can create polished reports automatically using your own templates in Google Slides or Google Sheets. No more copy-pasting or screenshots. The platform keeps everything in sync in real time and highlights the metrics that actually matter.
Whether you’re working solo or managing a team, ViewMetrics makes monthly reporting faster, cleaner, and much less stressful.- Connect all your data sources in one dashboard
- Use your own templates to auto-generate reports
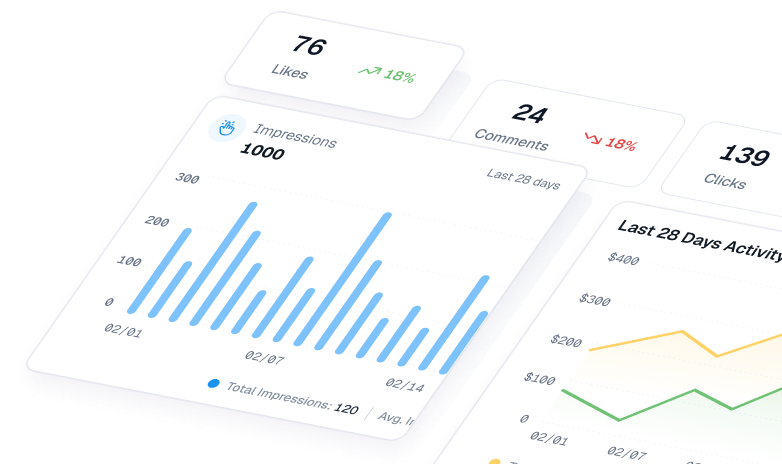
- Create real-time dashboards for live performance tracking
- Share reports or embed charts in tools like Notion and Confluence
- Separate client data into clean workspaces
Pricing
- Free: $0 (1 data source)
- Starter: $19/month (3 data sources)
- Professional: $39/month (10 data sources)
- Team: $99/month (25 data sources)
Best For
Marketing agencies, consultants, and teams that need to simplify reporting and save time. If your current setup feels too manual, ViewMetrics will feel like an upgrade.  Connect Instagram, Mailchimp, Google Analytics & more
- Pre-built dashboards, no setup needed
- Save hours on reporting every week
-
Tableau (Great Tool for Deep Analysis)
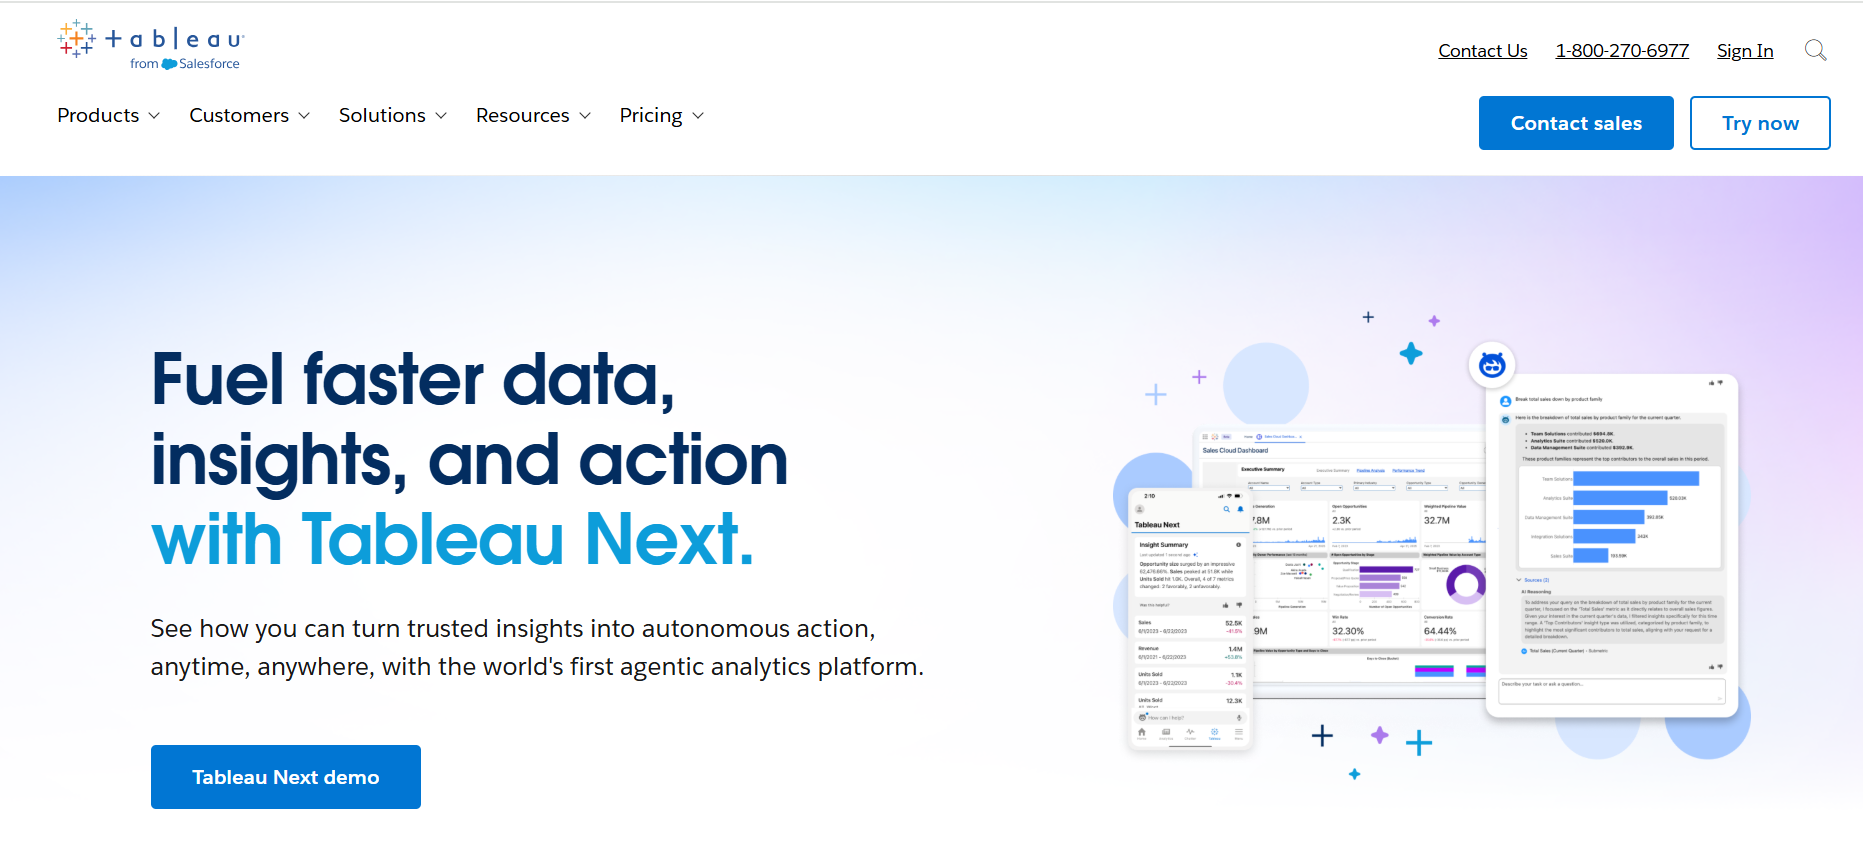
Tableau has been around for a while and is trusted by companies that deal with huge amounts of data. It’s ideal if you need complex dashboards, advanced visualizations, and deep control over your reports.You can connect Tableau to almost any data source, model your data, and build powerful dashboards that respond to user input. It has tools for data prep, AI analysis, and secure sharing. But keep in mind, it works best if you have some technical knowledge or a team that can handle setup and maintenance.
Key Features
- Advanced charting and visualization tools
- Natural language queries with Tableau Agent
- Drag-and-drop dashboard builder
- Connects to hundreds of data sources
- Secure, enterprise-grade deployment options
Pricing
- Viewer: $15/user/month
- Explorer: $42/user/month
- Creator: $75/user/month
- Custom pricing for Tableau+ and enterprise plans
Best For
Large organizations with data teams. If you want full control over every piece of your report and need scalable enterprise features, Tableau delivers. -
Microsoft Power BI (Great for Microsoft Ecosystem Users)
If your team already uses Microsoft tools like Excel, Teams, or SharePoint, Power BI might feel like a natural fit. It blends business intelligence with real-time data dashboards and offers deep integration with other Microsoft services.The desktop version is free and gives you access to solid report-building tools. For sharing and collaboration, you’ll need a paid plan, but it’s still more affordable than many other platforms.
Key Features
- Tight integration with Excel, SharePoint, and Teams
- AI-powered visualizations and predictions
- Real-time data streaming
- Over 100 data connectors
- Seamless connection with Power Apps and Power Automate
Pricing (2025)
- Desktop: Free
- Pro: $14/user/month
- Premium Per User: $24/user/month
- Premium Capacity: Starts at $4,995/month
Best For
Teams using Microsoft 365 tools who want a powerful yet familiar BI platform. It’s ideal for mid-sized to large companies that want smart reports without jumping between tools. -
SAP Data Intelligence Cloud (For Large-Scale Data Management)
SAP’s Data Intelligence Cloud is built for enterprise-level operations. If you’re managing tons of data across SAP and non-SAP systems, this is the kind of tool you need.It works well in hybrid environments and offers strong data governance and security. The platform helps you manage, integrate, and analyze different types of data, including structured and streaming data.
Key Features
- Centralized control over enterprise data
- Built-in tools for ML operations
- Designed for hybrid cloud setups
- Automates data flows with production-ready pipelines
- Tight SAP ecosystem integration
Pricing
- Custom enterprise pricing based on business size and complexity
- Typically ranges from five to seven figures annually
Best For
Large enterprises, especially those already using SAP systems. If compliance, security, and large-scale data orchestration are a priority, this tool makes sense. -
Google Analytics 360 (For High-Traffic Websites and Big Teams)
Google Analytics 360 is the premium version of Google Analytics, now built within the GA4 system. It’s designed for large-scale operations where data volumes are high, and the need for accuracy is critical.It comes with advanced attribution tools, faster data processing, and strong integration with other Google tools like BigQuery and Google Ads.
Key Features
- Unsampled reporting for better data accuracy
- BigQuery integration for custom analysis
- Roll-up reporting across domains
- Historical data retention for 50 months
- Dedicated support and SLAs
Pricing
- Starts at $50,000/year for 25 million monthly events
- Larger implementations can exceed $150,000/year
- Additional costs apply for storage and extra services
Best For
Enterprises with high web traffic and large marketing teams. If you’re deep into the Google ecosystem and need unsampled, high-quality data for reporting, this is a solid pick. -
Qlik Sense (For Deep, Flexible Exploration)
Qlik Sense is built around its associative analytics engine. That means you don’t just follow a straight path in your data. You can explore in different directions and spot patterns that other tools might miss.It offers strong AI features and works across multiple cloud setups. The interface is clean, and the platform is built to support both analysts and everyday users.
Key Features
- Associative engine for flexible data exploration
- Predictive analytics powered by AI
- Self-service dashboards without IT support
- NLP search capabilities
- Touch-optimized for mobile users
Pricing
- Starter: $200/month for 10 users
- Standard: $825/month for unlimited users
- Premium: $2,750/month with advanced tools
- Enterprise: Custom pricing
Best For
Businesses that need deeper, non-linear data exploration. It works well for organizations with growing data needs and teams that want flexibility in how they explore insights. -
Sisense (Great for Embedded Analytics)
Sisense is great at bringing different data sources together and embedding analytics directly into your own products or dashboards. If you want your customers to see data without leaving your app, this is worth considering.It also handles complex datasets with ease and is built for teams that want to offer data insights without building everything from scratch.
Key Features
- In-chip processing for fast analysis
- White-label analytics for custom interfaces
- Strong embedded reporting capabilities
- Easy drag-and-drop dashboards
- Connects to many third-party tools and databases
Pricing
- Essential: $40,600–$60,000/year
- Advanced: $69,600–$138,000/year
- Pro: $109,000–$327,000/year
- Expect extra costs for AI, plugins, and data connectors
Best For
Software companies or businesses that want to embed analytics inside their product. Just make sure to plan ahead for the total cost, including extras. -
ThoughtSpot (Best for Search-Driven Analytics)
ThoughtSpot makes data analysis feel like doing a Google search. You type in a question, and the system shows you the data. It’s built for people who don’t want to learn how to build dashboards but still want insights fast.Its AI agent gives suggestions, pulls insights, and even recommends next steps based on the data you’re exploring.
Key Features
- Search-first interface with natural language queries
- Real-time dashboards and insights
- Smart recommendations through the Spotter AI agent
- Embedded analytics for custom apps
- Secure, multi-tenant architecture for enterprises
Pricing
- Essentials: $25/user/month
- Pro: $50/user/month
- Enterprise: Custom pricing
- Also offers credit-based, usage-focused plans
Best For
Companies that want to open up data to more people, especially non-tech users. If you want to make analytics simple and fast for your whole team, this tool is built for that. -
Databox (Simple and Fast Performance Tracking)
Databox is all about making dashboards quick and easy. You can set goals, connect your data, and track progress without needing much setup. It’s especially popular with marketing teams and agencies.With hundreds of ready-made templates and an app that works great on mobile, Databox is a great tool if you want performance insights on the go.
Key Features
- Over 250 pre-built dashboard templates
- Mobile-first design
- Set goals and track performance automatically
- Scheduled report delivery via email
- Integrates with 60+ platforms and 2000+ via Zapier
Pricing
- Professional: Starts at $159/month
- Growth: Starts at $399/month
- Premium: Starts at $799/month
- 14-day free trial available
Best For
Agencies and small to mid-sized businesses that want easy, no-fuss performance dashboards. If your focus is on goal tracking and fast setup, this one delivers. -
Zoho Analytics (Affordable and Full-Featured)
Zoho Analytics is a hidden gem for teams that want big features without big costs. It comes packed with tools for reporting, dashboards, AI analysis, and even machine learning.It integrates smoothly with other Zoho products and offers solid customization options for teams that need to white-label or embed analytics.
Key Features
- Built-in AI assistant for insights and trends
- Predictive analytics with machine learning tools
- 500+ connectors for different data sources
- Embeddable dashboards and reports
- Competitive pricing for teams of all sizes
Pricing
- Basic: $30/month (2 users, 0.5 million rows)
- Standard: $60/month (5 users, 1 million rows)
- Premium: $145/month (15 users, 5 million rows)
- Enterprise: $575/month (50 users, 50 million rows)
Best For
Startups, small businesses, and growing teams that want a powerful BI tool without the high price. It’s even better if you’re already using other Zoho products.


View All Your Marketing and Website Data - Instantly
Closing Thoughts
Choosing the right reporting tool depends on what you need, how your team works, and how much time you want to spend managing data. If Looker Studio feels limiting, you’re not short on options. From simple dashboards to advanced analytics platforms, there’s something that fits every workflow and budget. Use this list as a starting point to explore what works best for you and your team.