Key Takeaways
- Google Ads KPIs help advertisers measure how effectively campaigns drive clicks, conversions, and revenue.
- Tracking the right KPIs in Google Ads makes it easier to optimize budgets, bids, and targeting.
- Metrics such as CTR, conversion rate, and ROAS reveal whether ads are relevant and profitable
- Display and video campaigns require separate KPIs for accurate evaluation.
- Tools like ViewMetrics simplify reporting by bringing all Google Ads insights into one place.
Running Google Ads without clear performance measurement often leads to wasted spend and unclear results. That is why Google Ads KPIs play such an important role in paid advertising success. These metrics help you understand which campaigns deliver results, which ads need optimization, and where budgets should be adjusted.
In this guide, you will learn which KPIs matter most, why they are important, and how to use them to improve ROI across Search, Display, and Video campaigns.
What are Google Ads KPIs?
Google Ads KPIs are measurable metrics that show how well your advertising campaigns perform against defined goals. They track outcomes such as clicks, conversions, costs, and revenue to help advertisers evaluate success and identify improvement areas.
By monitoring the right key metrics, you can understand your campaign efficiency, user behavior, and return on investment more clearly.
15 Google Ads KPIs At a Glance
The table below provides a quick overview of the top KPIs for Google Ads and why they matter.
| KPI | What It Is | Why It Matters |
| Click-Through Rate (CTR) | Ratio of clicks to impressions | Measures ad relevance |
| Conversion Rate | Percentage of completed actions | Shows effectiveness |
| Return on Ad Spend (ROAS) | Revenue per dollar spent | Measures profitability |
| Cost Per Click (CPC) | Average cost per click | Controls efficiency |
| Cost Per Conversion (CPA) | Cost of acquiring one conversion | Evaluates ROI |
| Quality Score | Google’s relevance score | Impacts CPC and rank |
| Impression Share | Eligible impressions received | Shows competitiveness |
| Average Position | SERP placement | Reflects visibility |
| Ad Relevance | Match between ad and intent | Improves performance |
| Landing Page Experience | Post-click quality | Affects conversions |
| Conversion Time Lag | Time taken to convert | Shows buying behavior |
| View-Through Conversions | Post-impression actions | Important for Display |
| Display Ads KPIs (CPM, CTR) | Display-specific metrics | Evaluate creatives |
| Engagement Rate (YouTube) | Video interaction level | Shows interest |
| Lifetime Value (LTV) | Long-term revenue value | Guides strategy |
15 Top Google Ads KPIs to Track in 2026
- Click-Through Rate (CTR)
CTR measures how often users click your ad after seeing it. This KPI shows whether your ad copy and targeting are relevant to search intent.
How to track: You can track CTR directly in the Google Ads dashboard.
- Conversion Rate (CVR)
This metric tracks the share of users who move from clicking an ad to completing a meaningful action. It helps evaluate how effectively ads turn clicks into results.
How to track: You can track conversion rate through the Google Ads dashboard and GA4.
- Return on Ad Spend (ROAS)
ROAS shows how much revenue your campaigns generate compared to the amount you spend on advertising. This important Google Ads KPI helps assess campaign profitability.
How to track: ROAS is available within Google Ads conversion reporting.
- Cost Per Click (CPC)
CPC shows the average amount paid for each click. It helps manage bids and control ad spend.
How to track: CPC data is available in the Google Ads interface.
- Cost Per Conversion
This metric measures how much it costs to acquire a conversion. It helps determine whether your campaigns are financially sustainable.
How to track: Cost Per Conversion is tracked in Google Ads conversion reports.
- Quality Score
Quality Score reflects ad relevance, landing page experience, and expected CTR. This KPI affects ad rank and CPC.
How to track: Quality Score is visible at the keyword level in the Google Ads dashboard.
- Impression Share
Impression share shows how often ads appear compared to eligible opportunities. It reflects competitiveness.
How to track: Impression share is available in campaign reports.
- Average Position
Average position indicates where ads appear on the SERP. This Google Ads KPI helps assess the visibility of your paid campaign.
How to track: You can view this in Google Ads search metrics.
- Ad Relevance
Ad relevance measures how closely your ads match the keyword intent. When you correctly measure this metric, it impacts your Quality Score.
- Landing Page Experience
Landing page experience reflects post-click usability and relevance. This KPI affects conversions and Quality Score.
How to track: Google Ads provides this metric under keyword diagnostics.
- Conversion Time Lag
Conversion time lag measures how long users take to convert after clicking an ad, revealing buyer behavior patterns.
How to track: You can track this useful Google Ads KPI using conversion reports.
- View-Through Conversions (VTCs)
VTCs track conversions that occur after users see an ad without clicking. This KPI is important for Display and Video campaigns.
How to track: VTC data is available in Google Ads attribution reports.
- Google Display Ads KPIs (CPM, CTR)
These Google Display Ads KPIs measure visual ad performance and reach. They help evaluate creative effectiveness.
How to track: You can track them within Display campaign reports.
- Engagement Rate (YouTube Ads)
Engagement rate measures interactions with video ads. This KPI indicates viewer interest.
How to track: YouTube Ads engagement metrics are available in Google Ads.
- Lifetime Value (LTV)
LTV measures the long-term revenue generated from customers. This KPI helps guide bidding and targeting strategies.
How to track: LTV can be tracked through GA4 and CRM integrations.


View All Your Marketing and Website Data - Instantly
 Connect Instagram, Mailchimp, Google Analytics & more
- Pre-built dashboards, no setup needed
- Save hours on reporting every week
How to Select the Right Google Ads KPIs?
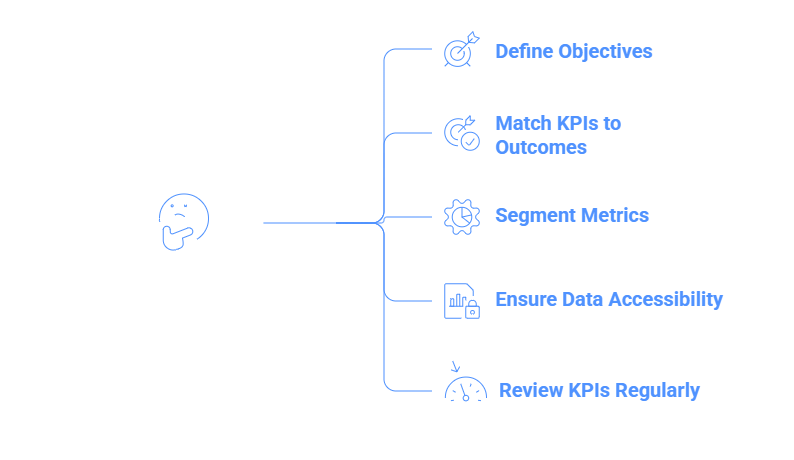
Tracking the right Google Ads KPIs can make a world of difference for better campaign performance outcomes. To understand which ones work best for you, here’s what to do:
- Define Campaign Objectives Clearly: Determine whether your goal is awareness, leads, or sales before selecting KPIs.
- Match KPIs to Business Outcomes: Ensure each KPI reflects what success means for your campaign.
- Segment Metrics by Campaign Type: Search, Display, and Video campaigns require different performance indicators. Ensure you segment metrics based on the type of campaign.
- Ensure Data Accessibility: Choose KPIs that are consistently available and reliable.
- Review & Adjust KPIs Regularly: Performance trends change, so KPIs should be evaluated periodically.
Why Does Google Ads KPI Tracking Matter for Campaign Success?
Tracking KPIs for Google Ads allows advertisers to move beyond surface-level numbers and focus on meaningful outcomes. Here are some reasons why this matters:
- Identify High-Converting Campaigns & Ad Groups: KPIs help pinpoint which campaigns, keywords, and ad groups generate the most conversions. This helps advertisers avoid spending on campaigns that are not driving the desired results.
- Direct Budget Toward Strong Performers: Performance data allows you to allocate spend to high-ROI keywords and audiences, instead of blindly spending.
- Minimize Spend on Ineffective Placements: KPIs reveal underperforming ads or networks, helping reduce wasted spend.
- Evaluate Performance Across Devices & Networks: You can compare results across Search, Display, and Video campaigns for more accurate campaign performance.
- Make Data-Driven Optimization Decisions: Consistent KPI tracking enables smarter bidding, targeting, and creative adjustments.
Tips to Improve Google Ads Performance
To make sure your Google Ads are performing well, so that you get the value of every dollar spent, it’s necessary to keep optimizing your KPIs through continuous testing and refinement. Here are some tips to help you:
- Test Ad Copy & Creatives Regularly: A/B testing helps identify which messages resonate most. With regular A/B testing, you can test your ad copy and creative by using multiple hooks and go with the one that works best.
- Use Negative Keywords Strategically: Negative keywords prevent wasted spend on irrelevant traffic.
- Segment Audiences Thoughtfully: Audience segmentation improves targeting precision. So, when analyzing your Google Ads KPIs, make sure to keep audience segmentation at the top of your mind.
- Improve Landing Pages Continuously: Better landing pages increase conversion rates. Ensure you’re continuously and regularly updating and improving landing pages.
- Automate Reporting for Accuracy: Automation saves time and reduces manual errors.
- Track Display KPIs Separately: Display campaigns require different evaluation methods.
- Analyze Conversion Paths Carefully: Understanding user journeys improves attribution accuracy.
Turn Your Google Ads KPIs Into Actionable Insights With ViewMetrics
Tracking the right Google Ads metrics helps you understand what is driving results, where budget is being wasted, and how your campaigns can improve over time. However, these metrics only create impact when they are easy to monitor, compare, and act on consistently.
That is where ViewMetrics fits in.
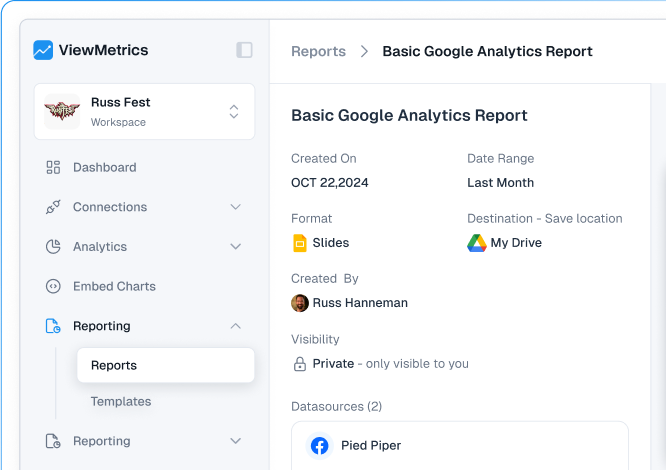
- Bring All Your Google Ads KPIs Together With ViewMetrics
ViewMetrics helps you centralize your Google Ads data and turn scattered metrics into clear, decision-ready insights.
✅ Connect your Google Ads account in seconds
✅ Track KPIs across Search, Display, and Video campaigns in one place
✅ Automate reporting with customizable dashboards
✅ Make faster, data-driven optimization decisions
View All Your Marketing and Website Data - Instantly
- Connect Instagram, Mailchimp, Google Analytics & more
- Pre-built dashboards, no setup needed
- Save hours on reporting every week
Frequently Asked Questions (FAQs):
-
Is $100 enough for Google Ads?
Yes, $100 can be enough to start testing Google Ads, but it is very limited and should be treated as an experiment rather than a full campaign budget.
-
What is the CTR formula for Google Ads?
The Google Ads Click-Through Rate (CTR) formula is simple: CTR = (Clicks ÷ Impressions) x 100.
-
Which KPIs matter most for Google Display Ads?
Important Google Display Ads KPIs include impressions, CTR, CPM, and view-through conversions.
-
How often should Google Ads KPIs be tracked?
It is ideal to track your Google Ads KPIs weekly, with daily checks for high-budget campaigns.
-
What does a high CTR but low conversion rate indicate?
A high CTR with a low conversion rate often signals strong ads but weak landing pages, which can be fixed with optimization.