Summary for the Blog
- X/Twitter analytics offer valuable insights into post performance and audience behavior, allowing you to refine your content strategy and engagement.
- Your guide provides a step-by-step process to access the native analytics dashboard on both desktop and mobile browsers, highlighting the different metrics available.
- Users can track key performance indicators such as impressions, engagement rate, profile visits, new followers, and link clicks.
- The guide also differentiates between the full analytics dashboard on desktop and the limited, individual tweet insights available on the mobile app.
In today’s digital world, posting on Twitter (now called X) is just the first step. To really grow your account or improve your content, you need to understand how your tweets are doing. This is why Twitter Analytics is very important to understand.
Whether you are a business owner, a content creator, or a marketer, checking your Twitter Analytics helps you see what is working and what needs to change.
In this blog, we will show you how to check Twitter Analytics, explain what the numbers mean, and how you can use them to do better on Twitter.
What are X (Twitter) Analytics?
Twitter Analytics is a free tool that shows how your tweets are performing. It gives you useful data like how many people saw your tweets, how many liked or shared them, and which posts are getting the most attention.
By looking at this data, you can understand what kind of content your audience enjoys, the best time to post, and how your profile is growing over time. It is like getting a report card for your tweets, so you can keep improving your content strategy.
Related Read - Essential Twitter KPIs You Need to Track for Better Results
How to Check Twitter Analytics?
There are different ways to check your Twitter Analytics depending on the device or tools you are using. Below are the three main methods:
- Via Mobile
- Via Desktop or Mobile Browser
- Via ViewMetrics

How to Check Twitter Analytics on Mobile?
If you mostly use Twitter on your phone, you can still check how your tweets are doing. While the mobile app does not show full analytics like the desktop version, it still gives you quick insights at the tweet level.
Option 1: Tweet-Level Insights – Via Mobile
You can see how each individual tweet is performing by following these steps:
Step 1: Open the Twitter (X) app on your mobile device.
Step 2: Go to your profile and find any tweet you’ve posted.
Step 3: Tap on the View Tweet Activity option just below the tweet.
Step 4: A screen will pop up showing useful data such as:
- Impressions: How many times the tweet was seen.
- Engagements: How many people interacted with the tweet ( likes, retweets, clicks, etc.)
- Engagement Rate: The percentage of people who engaged after seeing the tweet.
This feature helps you quickly check which tweets are performing well and which ones may need improvement, even when you're on the go.

Option 2: Use a Desktop or Mobile Browser
If you want more detailed analytics than the mobile app offers, you can access the full Twitter Analytics dashboard using your mobile browser. Here’s how to do it:
Step 1: Open your mobile browser (like Chrome or Safari) and go to analytics.twitter.com.
Step 2: Log in to your Twitter account using your username and password.
Step 3: Once logged in, you’ll have full access to the Analytics Dashboard, just like you would on a desktop computer. You can view a 28-day summary of your account, see performance details for individual tweets, and even track metrics like profile visits, follower growth, and more.
This method gives you a deeper dive into your Twitter data right from your phone.
Tip: Turn on Desktop Site mode in your browser settings for better usability.
How to Check Twitter Analytics on Desktop?
If you prefer a more detailed view of your Twitter performance, the desktop version of Twitter Analytics provides a comprehensive dashboard to track your data. Here’s how to access it:
Step 1: Log in to Your X (Twitter) Account
Go to twitter.com and log into your Twitter account. Once logged in, you'll land on your main dashboard where you can manage your tweets and profile.
Step 2: Navigate to the Menu
On the left-hand side of your screen, you'll see a menu. Click on Creator Studio and then select Analytics. This action will open the full Twitter Analytics dashboard.
Step 3: View Account Overview
The dashboard opens with an overview of your account's performance. Here, you’ll find key metrics like:
- Total Tweet Impressions: How many times your tweets were seen.
- Engagement Rate: Percentage of people who interacted with your tweets.
- Profile Visits: How many times your profile was visited.
- Mentions: How often your profile was mentioned.
- New Followers: How many followers you gained.
You can filter the data by custom date ranges to explore trends over time, whether for a specific week, month, or custom period.

Step 4: Explore Metrics in Detail
Use the drop-down menus in the Analytics dashboard to switch between different types of metrics, such as engagements, clicks, and reach. You can also adjust the graph view to compare performance with visual clarity. Scroll down to see more detailed data points, percentages, and trends.
Step 5: Review Individual Tweet Performance
To get a deeper look into the performance of specific tweets, click the Tweets tab. This will show detailed data for each of your individual posts, including impressions, engagements, and engagement rate.
If you're looking for more content-specific insights, head to the content tab, where you can view your top-performing tweets and see engagement per post, helping you pinpoint what resonates most with your audience.
Pro Tip: You can export the analytics data in CSV format for deeper analysis or reporting.
How to Check Twitter Analytics with ViewMetrics?
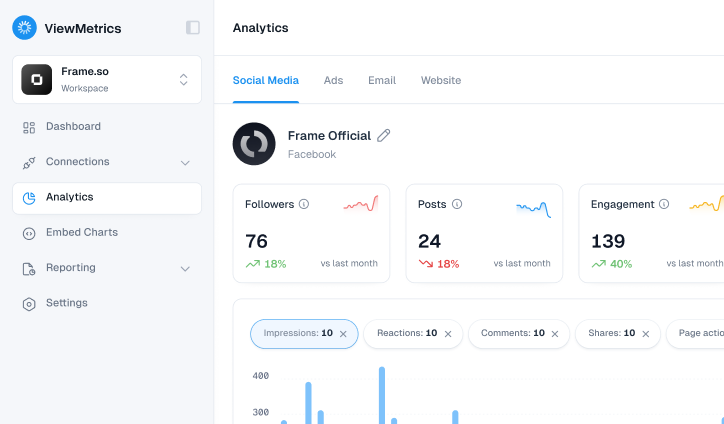
If you want a smarter and more visual way to track your Twitter performance, ViewMetrics makes it easy. It goes beyond basic numbers and helps you really understand what’s working on your account.
Step 1: Go to www.viewmetrics.com
Step 2: Sign in using your Twitter account.
Step 3: Allow the necessary permissions so ViewMetrics can access your analytics data.
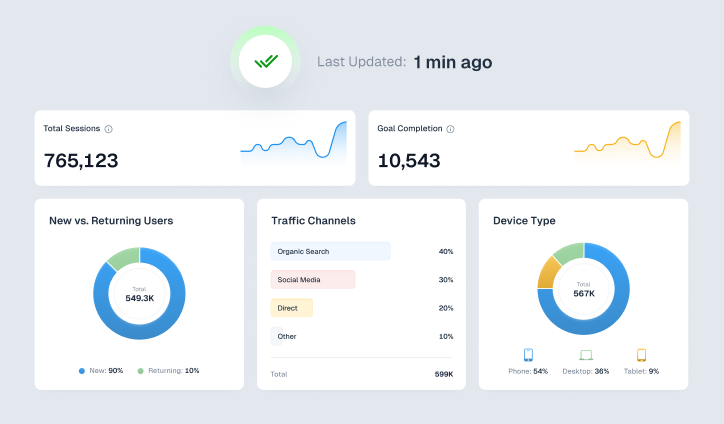
Step 4: Once you're in, you'll see detailed charts and reports that show how your tweets are performing, what your audience responds to, and how your account is growing over time. With ViewMetrics, you get a clean, user-friendly dashboard that turns your Twitter data into easy-to-read insights, perfect for making smarter social media decisions.
Tracking your Twitter analytics doesn’t have to be complicated. Whether you're using the mobile app, desktop site, or a tool like ViewMetrics, you can quickly see what’s working and where to improve. By understanding your tweet performance, engagement trends, and audience behavior, you’ll be better equipped to grow your presence on Twitter. Start checking your analytics today and take the guesswork out of your strategy.
Frequently Asked Questions (FAQs)
Is Twitter Analytics free?
Yes, it's free for all users. You just need to have a Twitter account that’s been active for at least 14 days.
Can I check Twitter Analytics through the mobile app?
Partially. You can see insights for individual tweets, but the full analytics dashboard is only available through a web browser.
Why am I unable to access my Twitter Analytics?
If your account is brand new or hasn’t been active lately, analytics might not show up. Make sure your account is at least two weeks old and you’ve posted recently.
How frequently is Twitter Analytics data refreshed?
The data updates almost instantly, usually just a few minutes after someone engages with your content.
Can I download my Twitter Analytics data?
Yes, you can. Just go to the Tweet Activity section and click the “Export Data” button to download a CSV file with your tweet metrics.
Why don’t I see the full analytics on my phone?
The app only shows basic insights for each tweet. To view the complete dashboard, open analytics.twitter.com in your phone’s browser.
What’s a good tool to get more in-depth Twitter analytics?
ViewMetrics is a great choice. It offers advanced features and clear visual reports, making it ideal for creators, marketers, and businesses.
How to see who's looking at your Twitter?
Twitter (now X) does not allow users to see exactly who has viewed their profile. However, you can view profile visits, tweet impressions, and engagement data using Twitter Analytics. This gives you an overview of your audience behavior, though it doesn't identify individual viewers.
How do I find my most liked tweet?
To find your most liked tweet:
- Go to your Twitter profile
- Click "Posts" or "Media"
- Scroll through and look for the tweet with the highest number of likes
For a quicker option, use Twitter Analytics or third-party tools like ViewMetrics or Tweet Binder to sort tweets by engagement metrics.
How to see who checks your Twitter?
Twitter doesn’t show who checks or visits your profile due to privacy policies. But you can get a summary of profile visits, mentions, and tweet activity in your Twitter Analytics dashboard to understand your account's reach and performance.
Where can I see audience insights on X (formerly Twitter)?
You can find audience insights by visiting Twitter Analytics and navigating to the "Audiences" section. This gives data on:
- Demographics
- Interests
- Location
- Device usage
It helps you tailor content to better engage your followers.
What is a good free app to monitor Twitter activity?
A few reliable free tools to monitor Twitter activity include:
- ViewMetrics – Offers clean, user-friendly Twitter analytics
- Followerwonk – Basic insights on followers and engagement
- Union Metrics – Free snapshot reports on tweet performance
These tools can help you track mentions, best-performing tweets, and audience behavior.


