

If you’re handling marketing for your brand or clients, you already know how much data piles up every month. Clicks, conversions, traffic, reach, and engagement are a lot to track. That’s where a good monthly marketing report comes in. It helps you bring all those numbers together in one clear picture, showing what worked, what didn’t, and where to focus next. In this guide, we’ll walk through how to create a simple, useful marketing report that saves time and actually helps you make smarter decisions.
What Is a Monthly Marketing Report?
A monthly marketing report is a document that gives you a clear picture of how your marketing efforts performed over the past month. It brings together results, KPIs, and trends from channels like SEO, paid ads, and social media in one place. By going through it, you can see what’s working well, what needs attention, and how your campaigns are moving toward your goals. It’s also a useful way to show your clients or team the value of your work and plan smarter strategies for the next month.
Also read – What are Marketing Reports?
What To Include in a Monthly Marketing Report?

Here’s what you should include in your monthly marketing report to give a clear picture of what’s working and what’s not.
-
Executive Summary
Start with a short summary that highlights the main takeaways. This helps your team or clients get the big picture without digging through all the details.
-
Goals
List the goals you set at the beginning of the month. This could be things like boosting website traffic, increasing leads, or improving engagement.
-
Overview of Activity
Give a quick recap of what marketing activities took place. Mention campaigns, content you published, events you ran, or emails you sent.
-
Marketing Key Metrics
Include the main numbers that show how your marketing performed. Focus on things like conversions, click-through rates, impressions, and ROI.
-
Performance by Channel
Break down how each marketing channel performed. Cover email, paid ads, social media, SEO, and any others you’re using. This helps identify what’s driving results.
-
Ad Spend
Show how much you spent on advertising during the month. Include the platforms you used and whether you stayed within budget.
-
Search Engine Optimization (SEO)
Highlight SEO performance. Talk about keyword rankings, organic traffic growth, backlinks gained, or any technical fixes you worked on.
-
Social Media Performance
Share how your social media platforms performed. Include data on reach, engagement, follower growth, and top-performing posts.
-
Insights and Recommendations
Wrap it up with your thoughts on what the data means. Mention what worked, what didn’t, and what you plan to change or improve next month.
How To Create a Monthly Marketing Report?
If you’re putting together a monthly marketing report, the goal is to give a clear picture of how your efforts are performing. It should show what’s working, what’s not, and what needs to change. Here’s a simple step-by-step guide to help you build a report that actually makes sense to the team and adds value.
Step 1: Identify Your Goals and Pick the Right KPIs
Start by asking yourself what you’re trying to achieve. Are you focusing on brand awareness, lead generation, conversions, or engagement? Once you’re clear on the goal, choose the KPIs that reflect it. For example, if your goal is more traffic, you’ll want to track page views, sessions, and bounce rate. If it’s lead generation, look at form submissions or sign-ups. Make sure everything ties back to your overall marketing strategy.
Step 2: Collect Data from All Your Marketing Channels
Now it’s time to collect the numbers. Look at all your marketing platforms and pull data from each one:
- Website traffic and engagement: How many people visited? How long did they stay?
- Paid ads: What did you spend and what did you get in return?
- Email marketing: Open rates, click-through rates, and overall engagement.
- Social media: Follower growth, post reach, likes, comments, and shares.
Collect everything in one place before moving on.
Step 3: Structure the Report in a Clear Way
Once you’ve collected the data, organize it so it’s easy to follow. A typical structure could look like this:
- Cover page: Keep it clean with the report title, date, and your company name or logo
- Summary: Give a quick snapshot of how things went over the month
- Goal overview: Briefly restate the goals and show how well you met them
- Channel-by-channel performance: Break down performance for each platform or campaign
- Comparative analysis: Show how this month compares to previous months
Keep it consistent each month so your team knows where to look.
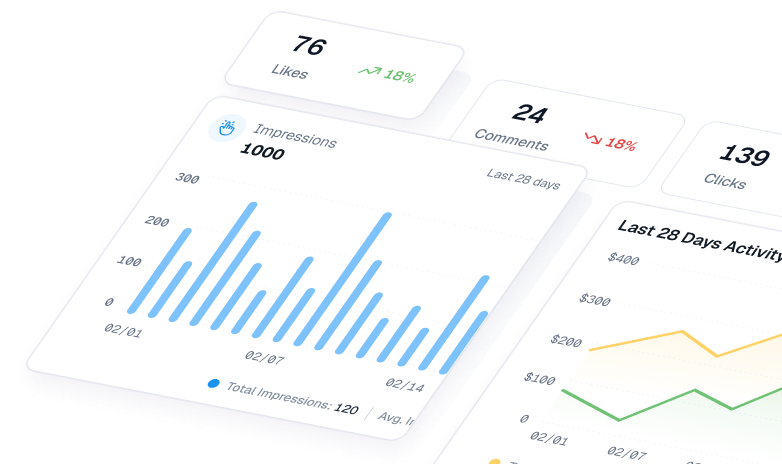
Step 4: Visualize the Data and Add Context
Don’t just paste raw numbers into the report. Use simple graphs, charts, or tables to make the data easy to read. A line chart can show traffic growth. A pie chart can highlight channel-wise performance. Alongside visuals, explain what the data means. Add short notes or callouts with insights like “Facebook engagement dropped mid-month, possibly due to fewer posts.”
Step 5: Wrap Up with Clear Recommendations
End the report with a section that suggests what to do next. Based on the data, what should you keep doing, stop doing, or try differently? Should you increase ad spend, test a new email subject line, or post more videos on social? These recommendations show that you’re not just reporting but also thinking ahead.
Read related: Automated Reporting
How to Set Up Monthly Marketing Reporting in ViewMetrics?
Setting up your monthly marketing report in ViewMetrics is simple. Just follow these steps and you’ll have your report ready in no time.
Step 1: Log In or Create Your Account
If you’re new to ViewMetrics, start by creating an account. If you already have one, just log in with your details. Everything else begins from here.
Step 2: Connect Your Data Sources
Next, choose the platforms you want to pull data from. This could be your social media accounts, website analytics tools, ad platforms, or any other source where your marketing data lives. ViewMetrics pulls everything together from one place.
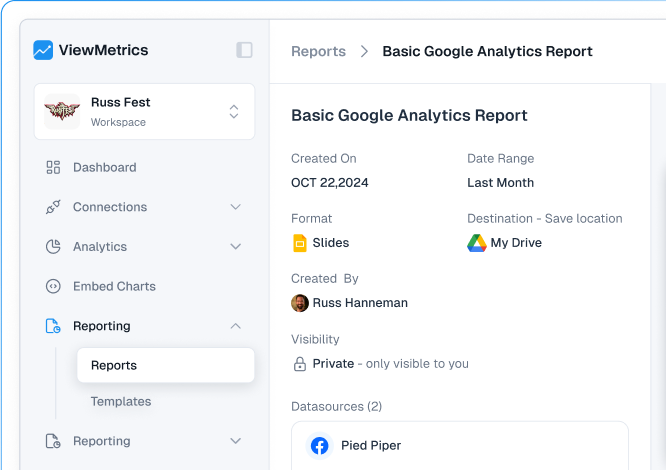
Step 3: Choose the Monthly Marketing Report Template
Once your data is connected, pick the ready-to-use Monthly Marketing Report template. This template is designed to highlight your monthly performance, so you won’t need to build anything from scratch.
Step 4: Select the Data Sources
Now choose exactly which data sources you want this particular report to include. You can select all or just a few, depending on what you want to track.
Step 5: Pick Your Report Format and Create
Decide how you want your final report to look. ViewMetrics lets you choose from different formats, like PDF or dashboard view. Once you’re happy with your selections, click on ‘Create Report’.
Step 6: Let ViewMetrics Do the Work
ViewMetrics will gather all your data and automatically generate your report. You can now review your insights, share the report with your team, or schedule it to be sent out every month.


View All Your Marketing and Website Data - Instantly
 Connect Instagram, Mailchimp, Google Analytics & more
- Pre-built dashboards, no setup needed
- Save hours on reporting every week
Why You Need a Monthly Marketing Report?

Here’s why you need a monthly marketing report:
-
See What’s Working and What’s Not
A monthly report helps you figure out which campaigns are hitting the mark and which ones aren’t delivering results. Instead of relying on guesswork, you’ll have real data showing what’s driving traffic, leads, or sales. This makes it easier to double down on what’s working and cut back on what’s not.
-
Make Smarter, Faster Decisions
When you have all your marketing data in one place, it’s easier to make informed decisions without wasting time. You don’t have to wait until the end of the quarter or rely on scattered reports. A clear monthly snapshot gives you the confidence to act quickly and adjust your strategy as needed.
-
Avoid Wasting Money
Marketing budgets can disappear fast if you’re not careful. A monthly report shows where your money is going and whether it’s bringing any return. This helps you stop spending on low-performing channels and move your budget to areas that actually work.
-
Spot Trends Early
Over time, these reports help you notice patterns. Maybe certain content types perform better at specific times of the month, or one platform keeps pulling in high-quality leads. By catching these trends early, you can adjust your strategy before missing out on big opportunities.
-
Justify Resources and Budget
If you need to ask for more resources or defend your current budget, having monthly reports makes the case stronger. You’ll be able to show exactly how your efforts are contributing to business goals. This is especially useful when talking to senior leadership or finance teams.
-
Keep Stakeholders in the Loop
Stakeholders don’t want long-winded updates. A good monthly report gives them a clear picture of how things are going. It helps them understand the value of your marketing efforts and keeps everyone aligned without needing multiple meetings.
-
Stay Accountable and Focused
Having to report on results each month keeps your team sharp and focused. It creates a rhythm where everyone is looking back at what was done and planning what comes next. This regular review helps teams stay accountable and aligned with bigger business goals.
Best Practices for Creating Monthly Marketing Reports

If you want your reports to be useful and easy to understand, here are a few simple things you can do:
-
Keep It Clear and Visual
No one wants to read long blocks of text. Use charts, graphs, and dashboards to make your data easy to read and understand. Visuals help stakeholders understand trends faster and make the report more enjoyable to go through.
-
Use the Same Format Every Month
Stick to the same reporting format each month. This helps everyone quickly compare progress and spot changes without confusion. Consistency also makes your reports look professional and organized.
-
Be Honest About Wins and Misses
Celebrate what worked, but don’t hide what didn’t. Transparency builds trust. It also helps your team learn from mistakes and figure out how to do better next time.
-
Add Insights, Not Just Numbers
Don’t just list data points. Include a short section on what the numbers mean and what actions should be taken. This makes the report more useful and helps guide future decisions.
-
Automate What You Can
Use tools like Google Data Studio, HubSpot, or Viewmetrics to pull in your data automatically. This saves time, reduces manual errors, and ensures your report is always based on the most recent numbers.
Closing Thoughts
A monthly marketing report is more than just a routine check. It helps you step back, review what’s happening, and decide what to focus on next. With a simple structure and a clear view of your data, you’ll find it easier to track progress, answer questions, and plan better. It also saves time during reviews and makes your team’s efforts more visible. Once you build a habit of reporting regularly, staying on top of your marketing becomes much smoother.
Frequently Asked Questions About Monthly Marketing Reports
-
Can I automate monthly marketing reports?
Yes, you can. Tools like Viewmetrics let you set up dashboards and reports to be sent automatically every month. This saves time, cuts out manual effort, and helps avoid mistakes in your reports.
-
How long should a monthly marketing report be?
It doesn’t have to be too long. A solid report usually runs between 5 to 10 pages or can even be a one-page dashboard. The goal is to focus on the most important metrics, insights, and trends without overwhelming anyone reading it.
-
Who should review a monthly marketing report?
Your monthly report should be shared with marketing managers, CMOs, business owners, or clients. Basically, anyone responsible for making decisions or tracking performance should take a look.
-
What is the difference between a monthly marketing report and a weekly report?
Weekly reports give you quick updates on what’s working right now and help with immediate decisions. Monthly reports are better for spotting bigger trends, measuring ROI, and planning your next moves.
-
Can I customize a monthly marketing report for different stakeholders?
Absolutely. With tools like Viewmetrics, you can create different versions of the same report. You might build one dashboard for your CEO, another for your marketing team, and one more for your clients, each showing only what they care about.
-
How long does it take to create a monthly marketing report?
If you’re doing it manually, it can take several hours or even days. But with Viewmetrics, you can pull reports in minutes. That means you can spend less time compiling and more time understanding the data.
-
What tools can I integrate with Viewmetrics for monthly reporting?
Viewmetrics works well with platforms like Google Analytics, Facebook Ads, Google Ads, LinkedIn Ads, Shopify, HubSpot, and more. You can connect all your major marketing tools in one place for a full-picture report.
-
How can I make my monthly marketing report actionable?
Don’t just list numbers. Try to pull out trends, point out what’s working, and suggest clear next steps. Add insights and recommendations that help guide the next campaign or strategy.


