
A digital marketing report is more than a collection of numbers; it’s a clear summary of how your campaigns are performing and whether they’re driving real business results. From website traffic and SEO to social media and paid ads, a well-structured report helps you see what’s working, what needs improvement, and how to adjust your strategy. In this blog, we’ll walk you through how to create a digital marketing report and the key elements you should always include to make it simple, insightful, and actionable.
What Is a Digital Marketing Report?
A digital marketing report is a structured summary that gathers data from your campaigns across various channels, such as SEO, email, social media, and PPC, and turns it into clear insights. It shows how your marketing is performing, highlights successes, uncovers issues, and guides your next steps.
Unlike a dashboard that merely displays live metrics, a report combines historical data, analysis, and recommendations to help stakeholders understand the “why” behind the numbers.
Why You Need a Digital Marketing Report?
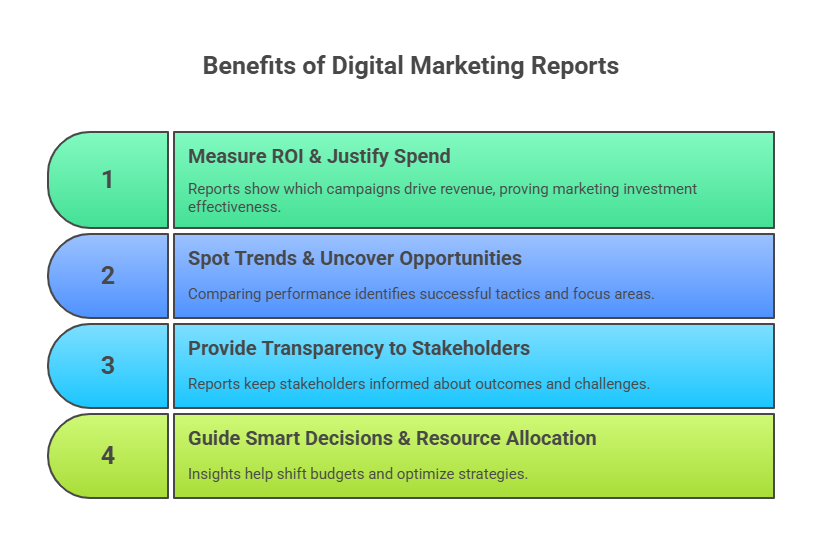
A digital marketing report is more than just numbers folded into a PDF; it’s a strategic tool that transforms campaign data into meaningful insights. Here’s why it’s indispensable:
-
Measure ROI & justify marketing spend
Reports help you show exactly which campaigns are driving revenue or leads, making it easier to prove that your marketing investment is paying off.
-
Spot trends and uncover opportunities
By comparing performance across channels and over time, you can identify which tactics are gaining traction and where to focus your efforts.
-
Provide transparency to stakeholders
A concise, well-structured report keeps leadership, clients, or teammates informed about marketing outcomes, challenges, and next steps.
-
Guide smart decisions and resource allocation
With clear insights, you can shift budgets, pause underperforming campaigns, and invest more in what works, making your strategy more efficient.
Related Article: 29 Digital Marketing Agencies to Operate Smarter and Scale Faster
What Are the Types of Digital Marketing Reports?
There’s no one-size-fits-all in digital marketing reporting. Depending on purpose, audience, and depth, reports tend to fall into different types. Here are the main ones:
-
Informational Reports
These offer a straightforward summary of what happened. They focus on basic metrics and performance over a time period, good for regular check-ins or high-level stakeholders.
-
Analytical Reports
These go deeper, not only showing what happened but why it happened. You’ll find trends, correlations, and insights that inform strategy changes.
-
Operational Reports
These are more tactical and granular. Operational reports focus on day-to-day performance, often used by marketing teams to monitor live campaigns and optimize execution.
-
Channel-Specific Reports
Here, you dive into individual channels, like SEO, PPC, social media, or email, and report metrics, performance, and insights unique to each platform.
Creating a Digital Marketing Report Is Not the Same for All Types
Although the basic process of creating a report, setting goals, gathering data, analyzing results, and presenting insights remains the same, the details can vary widely. Each type of digital marketing report comes with its own priorities, KPIs, and tools. For example, an operational report might highlight daily ad spend and click-through rates, while an analytical report digs into trends and ROI over time. Tailoring the structure to match the report type ensures the insights are meaningful and actionable.
Digital Marketing Report Example
Different reports serve different purposes, and the metrics you include should match the channel and goals you’re tracking. Here are some common examples:
SEO Reports
These focus on organic visibility. They track keyword rankings, website traffic from search engines, and backlink growth. The goal is to show how your SEO efforts improve search presence and drive sustainable traffic over time.
PPC Reports
Paid advertising reports highlight metrics like ad spend, clicks, impressions, cost-per-click (CPC), conversion rates, and return on ad spend (ROAS). They give a clear picture of how effectively your budget is being used and whether campaigns are profitable.
Email Marketing Reports
These measure the performance of email campaigns by analysing open rates, click-through rates (CTR), subscriber growth, and conversions. They help identify which messages resonate with your audience and where to optimize.
Related Article: Email Marketing KPIs: 17 Key Metrics to Track
Social Media Reports
Social reports capture follower growth, engagement rates, content performance, and even sentiment analysis across platforms. They show how well your brand is connecting with and influencing your audience online.
Related Article: 21 Social Media KPIs You Should Track
General Digital Marketing Reports
These combine data from multiple channels, SEO, PPC, social, email, and more, into one holistic view. They’re especially useful for executives or clients who want to see how marketing efforts align with overall business objectives.
In short, metrics, tools, and insights differ by channel, so a unified digital marketing report should combine these elements into one clear story.
How To Create a Digital Marketing Report?
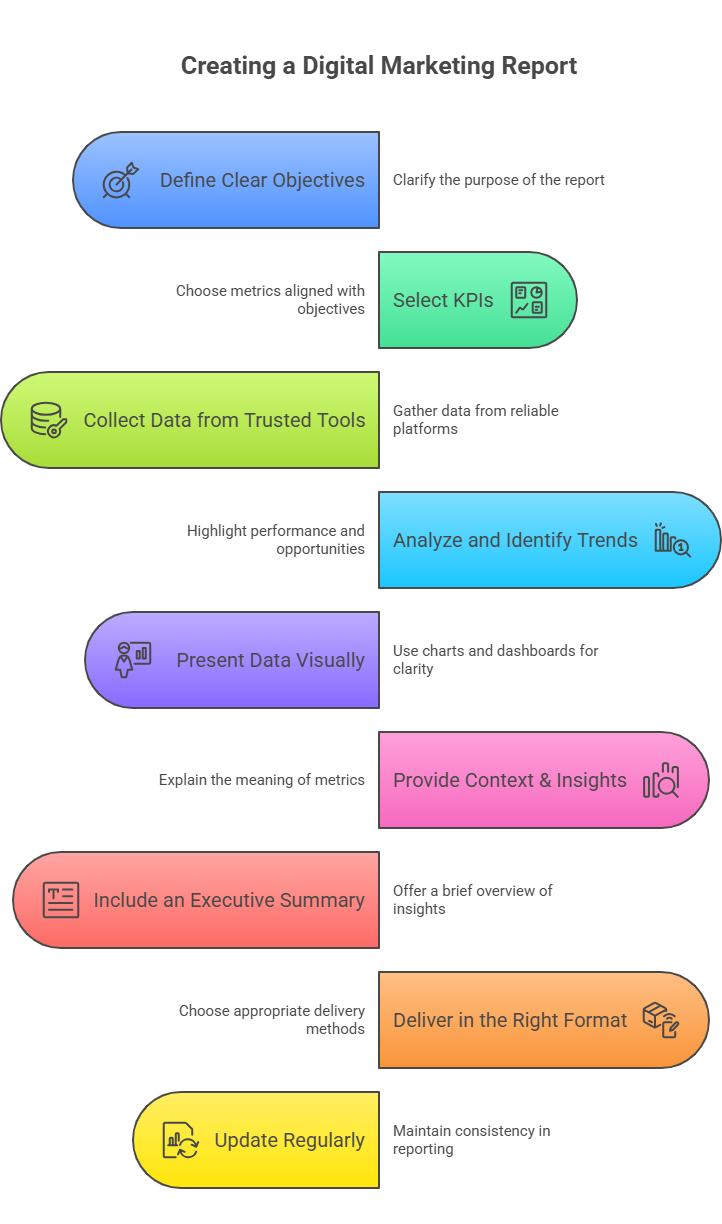
Building a digital marketing report is about more than pulling numbers; it’s about creating a clear story that decision-makers can act on. Here’s a step-by-step approach:
-
Define Clear Objectives
Start by clarifying the purpose of the report. Is it to track ROI, measure brand awareness, or review a specific campaign? Having clear objectives ensures the report stays focused and relevant.
-
Select KPIs
Choose metrics that align with those objectives. Examples include customer acquisition cost (CAC), customer lifetime value (CLV), organic traffic, click-through rate (CTR), or conversion rates.
-
Collect Data from Trusted Tools
Use reliable platforms like Google Analytics, SEMrush, Ahrefs, Mailchimp, social media insights, or Google Ads to gather accurate and consistent data.
-
Analyze and Identify Trends
Go beyond surface-level numbers, highlight what’s performing well, what’s underperforming, and where new opportunities may exist.
-
Present Data Visually
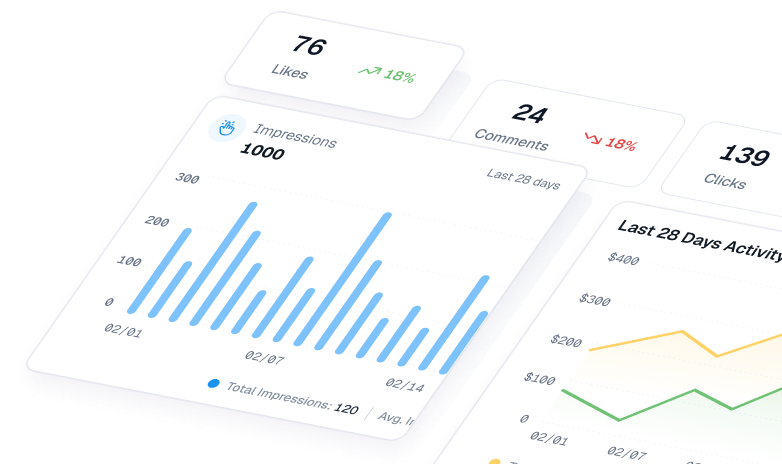
Charts, dashboards, and tables make complex data easy to digest. A visual presentation helps stakeholders understand insights quickly.
-
Provide Context & Insights
Don’t just present metrics, explain what they mean. For example, if traffic increased but conversions dropped, discuss potential reasons and what should be adjusted.
-
Include an Executive Summary
Offer a brief snapshot of the most important insights. This allows busy executives to understand performance without going through every detail.
-
Deliver in the Right Format
Choose the right delivery method based on your audience: PDFs or Slides for formal reporting, or live dashboards for real-time monitoring.
-
Update Regularly
Consistency is key. Whether weekly, monthly, or quarterly, regular reporting helps track progress and identify trends over time.
What To Include in a Digital Marketing Report?
A strong digital marketing report doesn’t just list numbers; it highlights the right information in a way that connects results to business goals. Here are the key elements to include:
-
Executive Summary
Begin with a short overview of the reporting period. Highlight major wins, challenges, and key takeaways so decision-makers can get the gist without diving into details.
-
Website Analytics
Track core metrics like traffic, bounce rate, average session duration, and top-performing pages. This shows how users interact with your site and whether it’s supporting your goals.
-
SEO Rankings and Traffic
Include keyword rankings, organic impressions, clicks, and traffic from search engines. These insights demonstrate how your SEO efforts are driving visibility and long-term growth.
-
Paid Advertising Results (Google Ads, Meta Ads, etc.)
Report on ad spend, impressions, clicks, CPC (cost-per-click), conversions, and ROAS (return on ad spend). This helps evaluate the effectiveness of paid campaigns across platforms.
-
Social Media Insights
Show engagement rates, follower growth, reach, and top-performing posts across channels. These metrics help measure brand awareness and audience connection.
-
Email Marketing Performance
Include open rates, click-through rates, subscriber growth, and conversions from campaigns. This section reveals how well email drives engagement and customer actions.
-
Lead Generation and Sales Outcomes
Track leads, MQLs (marketing-qualified leads), pipeline contribution, and closed sales. This ties marketing activity directly to business growth.
-
Recommendations & Next Steps
Wrap up with clear suggestions for improvement. For example, increase investment in channels with high ROI, refine underperforming campaigns, or test new strategies.
Why Use ViewMetrics?
Manually gathering data from multiple platforms can be time-consuming and error-prone. ViewMetrics simplifies this process by connecting all your marketing channels in one place and turning raw numbers into meaningful insights. It’s designed for marketers who want to spend less time building reports and more time improving campaigns.
Here’s why ViewMetrics stands out:
-
Unified Reporting Across Channels
ViewMetrics integrates with major platforms like Google Analytics, Meta Ads, LinkedIn, Mailchimp, and YouTube, giving you a single, real-time view of your marketing performance.
-
Automated Data Syncing
No more manual data entry. ViewMetrics automatically pulls fresh data into your dashboards or report templates, ensuring that your metrics are always up to date.
-
Easy-to-Use Templates and Add-ons
Choose from customizable templates for Google Slides, Sheets, and Docs, or use the ViewMetrics Google Workspace add-on to embed live data directly into presentations and reports.
-
Actionable Insights, Not Just Numbers
Beyond displaying KPIs, ViewMetrics helps you uncover trends, compare performance across periods, and make data-driven decisions that actually move the needle.
-
Collaboration Made Simple
Whether you manage multiple clients or internal teams, ViewMetrics lets you organize data by workspaces, assign user roles, and share branded reports effortlessly.
In short, ViewMetrics turns complex marketing data into visual stories that inform strategy, impress stakeholders, and save hours every week.
How to Set Up Digital Marketing Reporting in ViewMetrics?
Getting started with ViewMetrics is quick and helps you streamline reporting across all your marketing channels. Here’s how you can set it up step by step:
-
Sign Up & Choose Your Plan
Go to ViewMetrics and create your account. You can start with the Free plan (up to 3 data sources) or upgrade to the Starter plan for just $19/month if you need more integrations.
-
Connect Your Data Sources
In your dashboard, add the platforms you want to track. ViewMetrics integrates seamlessly with tools like Google Analytics, Facebook Ads, LinkedIn Analytics, Mailchimp, YouTube, ActiveCampaign, Constant Contact, and more.
-
Create or Select a Template
Pick from a ready-made digital marketing report template for Google Sheets or Slides, or design one from scratch. Once connected, ViewMetrics will automatically fill your template with charts, screenshots, and performance metrics.
-
Use the Google Workspace Add-On (Optional but Powerful)
Install the ViewMetrics add-on from the Google Workspace Marketplace for Sheets, Slides, or Docs. This allows you to insert live, real-time data directly into your documents and presentations.
-
Customize Your Dashboard & Workspace
Organize your reports into dedicated workspaces, which is especially useful if you manage multiple clients or campaigns. You can also assign team member roles for smooth collaboration.
-
Automate Report Syncing
Set a refresh schedule, daily, weekly, or monthly, so your data updates automatically. This eliminates manual reporting and ensures your insights are always up to date.
-
Embed Charts & Download Visuals
Easily embed live charts into tools like Notion or Confluence, or export visuals for use in presentations, PDFs, or offline reporting.
-
Share and Present
Present your data using branded templates or dashboards. Whether in Google Slides, Sheets, or live dashboards, ViewMetrics ensures your reports look professional and ready to share instantly.
Best Practices for Digital Marketing Reporting
-
Keep it simple
Don’t overload your report with every metric under the sun. Stick to what truly matters. Clear, focused insights beat overwhelming details.
-
Automate where possible
Use reporting tools to automate data collection and updates. This saves time and reduces manual errors, making your reports more reliable.
-
Highlight ROI
Always tie your marketing efforts back to business results. Show how campaigns impact leads, revenue, or conversions, not just vanity metrics.
-
Compare periods
Use month-over-month or year-over-year comparisons to show growth trends and signal what’s improving or declining.
-
Customize for the reader
Tailor your report depending on who’s reading it. Executives want the high-level story, while marketing teams might need deeper metrics and context.
A digital marketing report isn’t just about tracking numbers; it’s about telling the story behind your campaigns and using that story to shape better decisions. By including the right metrics, presenting them clearly, and tying every insight back to business goals, your reports can move from being routine documents to powerful strategy tools. With platforms like ViewMetrics, you can simplify this process by automating reports, visualizing data, and sharing results in a way that’s both clear and impactful. Start creating smarter reports today, and turn your marketing data into real growth opportunities.


View All Your Marketing and Website Data - Instantly
 Connect Instagram, Mailchimp, Google Analytics & more
- Pre-built dashboards, no setup needed
- Save hours on reporting every week
Frequently Asked Questions
How often should you create a digital marketing report?
The frequency of your reports should match your business needs. Many organizations rely on monthly reports to evaluate overall performance and ROI. However, weekly reports help monitor short-term campaigns or ad spend, while quarterly reports provide a broader view of long-term trends and growth. The key is to choose a rhythm that balances timely insights with the ability to spot meaningful patterns.
What is the difference between a digital marketing report and a dashboard?
A digital marketing report is usually a static document (like a PDF or presentation) that summarizes performance over a defined period, highlighting results, trends, and recommendations. A dashboard, on the other hand, is dynamic and updates in real time, allowing you to monitor ongoing metrics instantly. Think of the dashboard as your live “control center” and the report as the polished story you share with clients or stakeholders.
Which tools can I use to create a digital marketing report?
There are plenty of tools that make reporting easier. Platforms like HubSpot, SEMrush, and Ahrefs are excellent for SEO and campaign performance tracking. If you want a streamlined solution that pulls in data from multiple sources and automates reporting, ViewMetrics is a great option. It integrates with major platforms like Google Analytics, Meta Ads, LinkedIn, and more, so you can save time and deliver professional reports with ease.
What makes a digital marketing report effective?
An effective report goes beyond numbers. It should be clear and easy to follow, focus on relevant KPIs, use visuals like charts and graphs to simplify complex data, and most importantly, provide actionable insights. A report that tells a story, what worked, what didn’t, and what to do next, is far more valuable than one that just lists metrics.
Should I include competitors’ data in my report?
Yes, whenever possible. Including competitor benchmarks provides context for your own performance. For example, if your click-through rates are below the industry average, that insight can guide you to refine ad copy or targeting. Competitor data transforms your report from a simple performance tracker into a strategic comparison tool.
What is the purpose of including recommendations in a marketing report?
Metrics show what happened, but recommendations explain what should happen next. By adding recommendations, you turn raw data into a roadmap for improvement. For example, if your SEO report shows strong performance from blog posts, you might recommend producing more long-form content. These actionable steps help marketing teams and decision-makers know exactly how to optimize resources and campaigns.
Key Takeaways
- Digital marketing reports turn data into insights that guide smarter decisions.
- They help measure ROI, spot trends, provide transparency, and optimize campaigns.
- Types include informational, analytical, operational, and channel-specific reports.
- Strong reports cover KPIs across SEO, PPC, social, email, and lead generation.
- Tools like ViewMetrics make reporting easier with automation and integrations.
- Best practices: keep it simple, highlight ROI, compare periods, and tailor to your audience.


