Key Takeaways
- LinkedIn Analytics helps you understand how your posts and page are performing by showing data like views, clicks, and follower growth.
- It gives you a clear picture of who your audience is, what content they engage with, and when they are most active.
- You can track growth over time, compare your page with competitors, and refine your content strategy based on real insights.
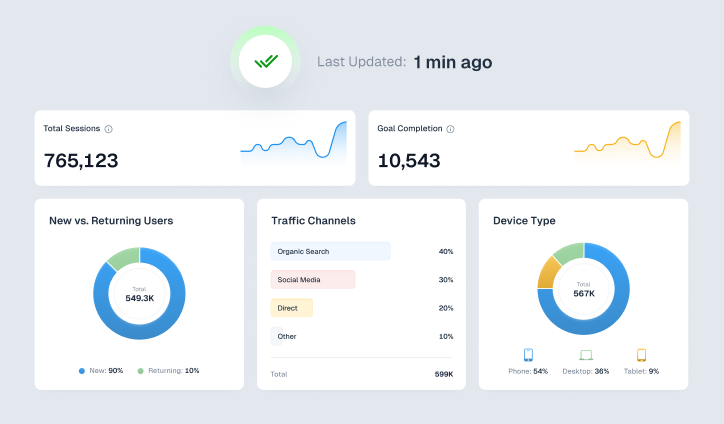
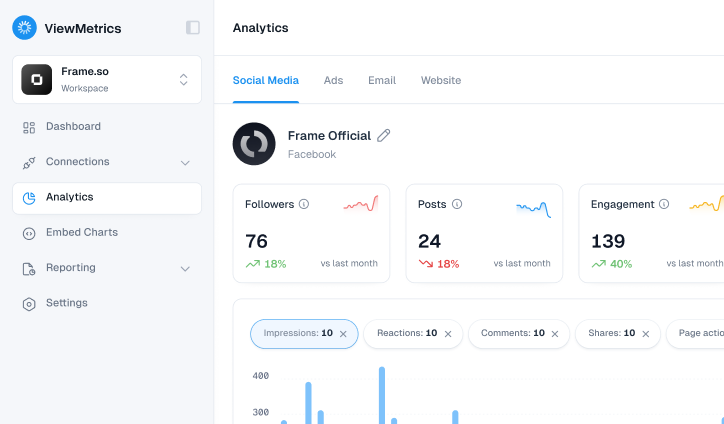
- Tools like ViewMetrics make it easier to generate custom reports and manage data in a cleaner format.
- Using these insights regularly can help you post with purpose, attract better leads, and grow your brand with more confidence.
You know that feeling when you post something on LinkedIn, then keep checking back to see who viewed it, how many likes it got, or if someone from your dream company noticed? Most of us have been there. But behind those little numbers is a whole world of insights waiting to be unlocked. Whether you’re building a personal brand, trying to get more visibility for your posts, or running a business page, LinkedIn Analytics can tell you exactly what’s working and what’s falling flat. In this guide, we’ll walk you through everything you need to know about LinkedIn analtyics so you can stop guessing and start growing with clear, easy-to-understand insights. Let’s get started.
What is LinkedIn Analytics?
LinkedIn Analytics is your built-in dashboard that shows how well your company page and posts are doing. It gives you all the important numbers in one place, such as how many people saw your posts, clicked on them, liked them, or followed your page. You also get to see who your audience is, where they’re from, and what kind of content they are engaging with the most.
If you’re running a business or handling marketing, these insights can help you understand what’s working and what needs to be adjusted. You can use it to track how your organic posts are performing, measure the success of paid promotions, or check how your latest carousel or video is being received. If you’re trying to grow your brand or fine-tune your marketing strategy, these insights give you the clarity you need to improve your approach and connect better with your audience.
Related Article: Master LinkedIn KPIs for Maximum Engagement and Growth!
Why Do LinkedIn Analytics Matter?
If you’re serious about building your brand or growing your business LinkedIn anlytics play an important role. Here’s why:
-
Get to Know Your Audience Better
LinkedIn analytics help you understand who your followers really are. You can see their job titles, industries, locations, and even the size of the companies they work for. This lets you tailor your content to match what your audience actually cares about, instead of just guessing.
-
Watch Your Growth in Real Time
Want to know if your efforts are working? Analytics show you how your audience is growing over time. Whether you’re gaining followers steadily or seeing dips after certain posts, these numbers help you adjust your content strategy and spot what’s working.
-
Bring in the Right Leads
LinkedIn isn’t just for networking. It’s also a powerful tool for lead generation. By tracking what types of content drive the most engagement or click-throughs, you can figure out what’s pulling in the right people. This makes it easier to create posts that convert interest into actual business.
-
See How You Stack Up Against Others
LinkedIn lets you compare your performance with similar pages. This gives you a solid idea of how you’re doing in your space. Are others posting more? Getting better engagement? These insights help you stay competitive and adjust your strategy when needed.
-
Track Employee Advocacy
If your team shares company content, analytics show how far their posts go. You’ll be able to track impressions, clicks, and reactions generated by employees. This helps you understand the reach of internal advocacy and who’s making the biggest impact.
-
Refine Your Content Strategy
Beyond just likes and comments, analytics help you understand what kind of content works best. It could be articles, videos, text posts, or images. With that insight, you can stop wasting time on content that falls flat and focus on what your audience actually wants to see.
-
Time Your Posts Right
LinkedIn analytics also tell you when your audience is most active. Posting at the right time can boost visibility and engagement.
How to Access LinkedIn Analytics?
If you want to understand how your LinkedIn content is performing, there are two easy ways to check the analytics. You can either use LinkedIn’s built-in analytics tools or go with a third-party platform like ViewMetrics. Let’s walk through both options in detail.
Method 1: Using LinkedIn’s Native Analytics Tool
Whether you’re growing your personal brand or managing a company page, LinkedIn gives you the tools to track what’s working and what’s not. Here’s how you can easily check your analytics and understand the numbers behind your performance.
For Your Personal Profile
Step 1: Go to Your Profile
Start by logging in and clicking the “Me” icon at the top. Then, choose “View Profile” from the dropdown menu.
Step 2: Locate the Analytics Section
Scroll down your profile until you see the “Analytics” section. This is where LinkedIn gives you a quick snapshot of how your profile is performing.
Step 3: Click for More Details
To dive deeper, click “Show all analytics.” This opens up a dashboard with more detailed numbers.
Step 4: Understand the Key Metrics
Here’s what you’ll find inside:
- Post Impressions: Shows how many times your posts have appeared in others’ feeds. This helps you see what type of content gets noticed.
- Followers: Tracks how many people are following you and whether that number is going up or down.
- Profile Viewers: Lets you see who’s been checking out your profile, which can be helpful if you’re networking or job hunting.
- Search Appearances: Tells you how often your profile has shown up in LinkedIn searches. A higher number usually means your profile is optimized well with the right keywords.
These insights are helpful for figuring out what kind of content your audience engages with and how people are discovering you.
For a Company Page
Step 1: Head to Your Page
From your LinkedIn homepage, go to your company page.
Step 2: Open the Analytics Dashboard
At the top of the company page, you’ll see a tab labeled “Analytics.” Click it to open your dashboard.
Step 3: Explore the Main Sections
Your analytics dashboard will be split into different sections, each one offering valuable insights:
- Content: Shows how well your posts and updates are performing. It tells you what your audience is actually engaging with.
- Visitors: Gives details about who is visiting your page. You’ll see their job roles, industries, and how often they stop by.
- Followers: Tracks the growth of your follower count. It also shows you the makeup of your audience in terms of job titles and locations.
- Leads: If you’ve set up your page to collect leads, this section will show you how many leads you’re getting and where they’re coming from.
- Competitors: Lets you compare your page performance with similar businesses. It’s a useful way to see how you’re doing in your space.
You can also download these reports if you want to do a deeper analysis or share results with your team.
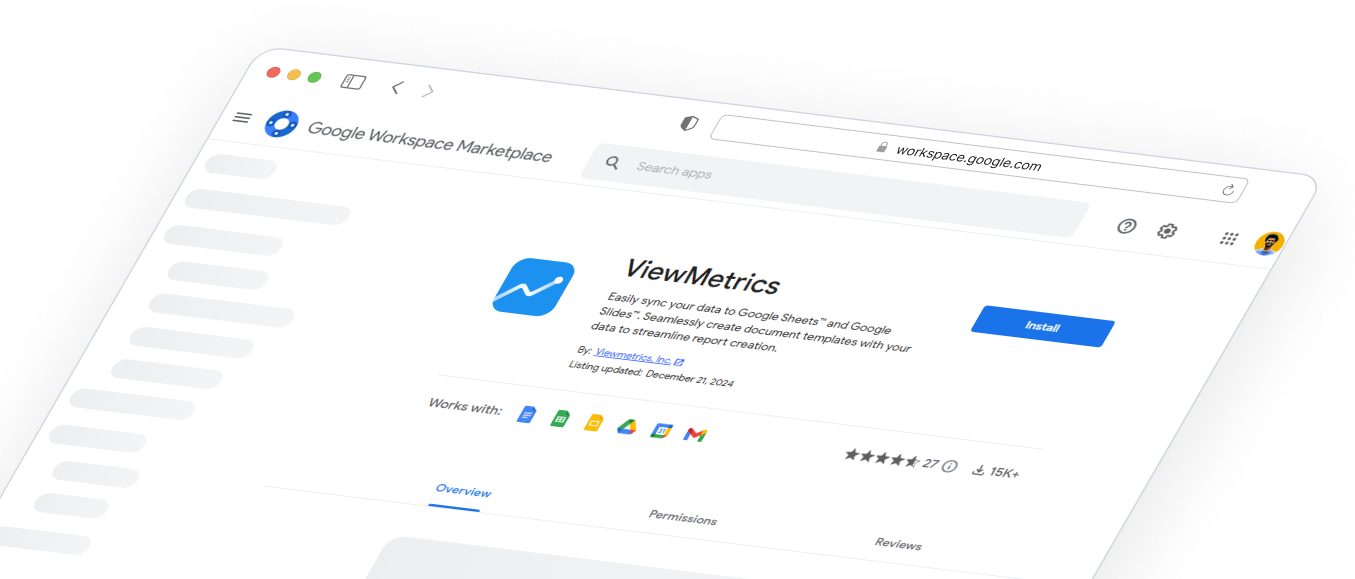
Method 2: Using ViewMetrics
If you’re looking for a clean, easy way to track your LinkedIn performance, ViewMetrics is a great tool to try. Here’s how you can use it to get your LinkedIn analytics in just a few steps:
Step 1: Sign Up or Log In
Start by going to ViewMetrics.com. If you’re new, sign up for a free account. If you already have one, just log in.
Step 2: Connect Your LinkedIn Account
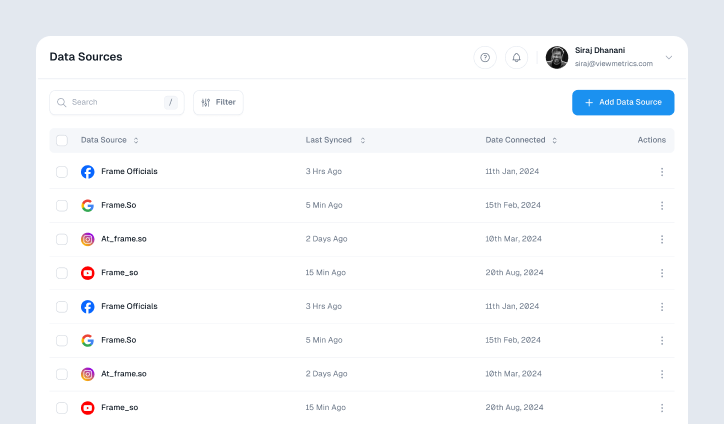
Once you’re inside the dashboard, look for the section that says “Connect Data Source.” Click on it, then select LinkedIn. The platform will guide you through the steps to securely connect your LinkedIn profile or company page.
Step 3: (Optional) Link Your Google Drive
If you want an easy way to store or access your reports later, you can also link your Google Drive. It’s optional, but handy if you want everything in one place.
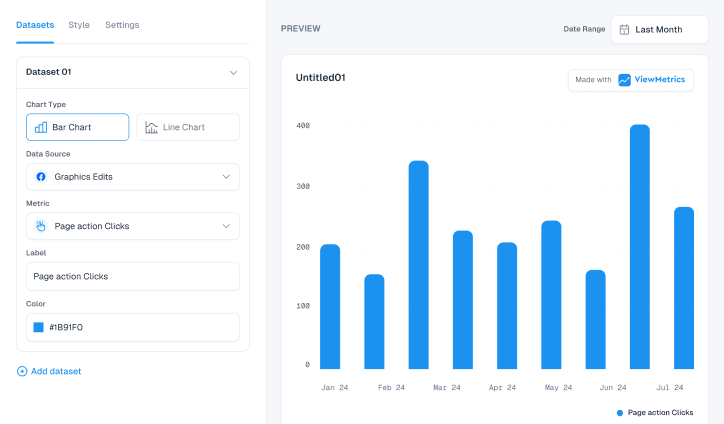
Step 4: Create a New Report
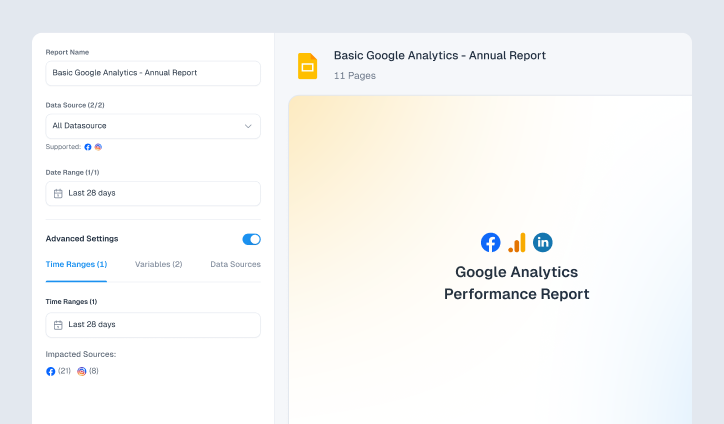
Go to the “Create New Report” section. Choose the LinkedIn Report Template and select the data source you just connected. This tells ViewMetrics which LinkedIn profile or page to pull data from.
Step 5: Pick Your Time Range and Report Format
Next, choose the time period you want to analyse. Then, pick the format you prefer. You can get your report as a PDF, Excel sheet, or a presentation file.
Step 6: Generate the Report
Click on “Create Report.” ViewMetrics will now pull your LinkedIn data and build a custom report for you. Once it’s ready, you can download it, share it with your team, or save it directly to your Google Drive.
Step 7: Explore the Dashboards
If you want a more hands-on view of your performance, head over to the interactive dashboards. Here, you can check post engagement, follower growth, and audience insights to fine-tune your LinkedIn strategy.
Key LinkedIn Metrics You Should Be Tracking
Whether you’re building a personal brand or managing a business page, these are the LinkedIn metrics you should be watching closely:
-
Visitor Analytics
This section tells you how many people are checking out your LinkedIn page and who they are. It includes:
- Page Views: This shows how often your page is being viewed. If your page views are going up, it usually means your content or profile is attracting attention.
- Unique Visitors: This tells you how many individual users are visiting your page. It helps you figure out your actual reach, not just repeated clicks.
- Visitor Demographics: Here, you can see the job titles, industries, locations, and seniority levels of people visiting your page. This info is useful if you want to know if you’re attracting the right audience.
-
Follower Analytics
These metrics show how your follower count is growing and who’s joining your network. It includes:
- Total Followers: The total number of people following your page or profile. It gives you a quick idea of your current audience size.
- Follower Trends: This shows how your follower count has changed over time. If there’s a sudden jump or drop, it’s worth checking what caused it.
- Organic Followers: These are followers who found your page on their own without paid promotions. A rise here means your content is naturally drawing people in.
- Follower Demographics: Just like with visitors, you can see what kind of professionals are following you. This helps you tailor content to fit their interests and roles.
-
Engagement Analytics
This is where you find out how people are interacting with your content. It includes metrics such as:
- Impressions: The number of times your posts showed up on someone’s feed. High impressions mean your content is being seen, but not necessarily clicked.
- Video Views: If you post videos, this shows how many people watched them. It helps you figure out if your video content is catching attention.
- Reactions: Likes, celebrates, insightful tags, and other reactions give you a sense of how your content is making people feel.
- Remarks: Comments show deeper engagement. If people are taking the time to share thoughts, it usually means the post resonated.
- Shares: Shared posts expand your reach to new audiences. If people are sharing your content, you’re doing something right.
- CTR (Click Through Rate): This measures how often people clicked on a link or CTA in your post. It’s a strong sign of interest.
- Follows: How many people followed you after seeing a particular post. This helps you identify which content converts viewers into followers.
- Engagement Rate: This combines all interactions like clicks, likes, comments, and shares. A higher engagement rate means people find your content valuable.
How to Create a LinkedIn Analytics Report Using LinkedIn?
Here’s a simple step-by-step guide to help you create and export a LinkedIn analytics report using the platform itself.
Step 1: Go to Your Company Page
First, log in to LinkedIn and head over to the company page you manage. You’ll need admin access to view and download analytics.
Step 2: Open the Analytics Tab
At the top of your company page, you’ll see a menu labeled “Analytics.” Click on it to open the dropdown.
Step 3: Pick the Type of Report You Want
Under the Analytics tab, you’ll find three main types of reports:
- Visitors: This report shows who’s visiting your page. You’ll see data like page views, number of unique visitors, and visitor details like job function, seniority level, industry, and company size.
- Updates: Here you’ll get a breakdown of how each of your posts is performing. You’ll see impressions, clicks, engagement rate, and video views if applicable.
- Followers: This section gives insights into your follower count, how it’s growing over time, what kind of audience you’re attracting, and even how your numbers compare with other similar pages.
Step 4: Choose the Time Frame
Once you’ve selected a report type, you’ll see an option to filter the data by date. You can choose from options like the last 30 days, last 90 days, or set a custom time period that works best for your reporting needs.
Step 5: Export the Report
In the top-right corner of the analytics dashboard, you’ll find an “Export” button. Click it and your report will download as a CSV or XLS file.
Best Practices for Using LinkedIn Analytics
Here are the best practices for using LinkedIn Analytics:
-
Set Clear Goals
Before diving into any data, ask yourself what you’re trying to achieve. Are you looking to boost brand awareness? Drive more traffic to your website? Or maybe generate quality leads? Once you’re clear on your goals, you can focus on the right metrics and stop wasting time on numbers that don’t serve your purpose.
-
Optimize Your Posting Schedule
LinkedIn Analytics shows you when your audience is most active. Use that to your advantage. Try posting during those peak times to give your content a better chance of being seen, liked, and shared. Timing really does matter when it comes to how your posts perform.
-
Experiment with Content Types
Not every audience responds to the same kind of content. Some might enjoy short videos. Others may prefer polls, carousels, or written posts. Keep testing different types of content and watch what performs best. Once you spot a pattern, lean into what works.
-
Get Your Team Involved
Ask your employees to interact with the content you post on your company page. When they like, comment, or share a post, it gets pushed into their networks too. This kind of organic boost can expand your reach and help your content gain more visibility without paying for ads.
-
Pay Attention to Comments and Engagement
Your audience is already telling you what they care about. Look at the comments on your most popular posts. What are people talking about? What questions are they asking? Use this feedback to come up with new content that directly answers their needs or keeps the conversation going.
Closing Thoughts
If you’ve made it this far, you’re already ahead of many who still post without checking their numbers. LinkedIn Analytics is much more than just charts and graphs. It’s about learning what connects with people and using that knowledge to grow. With the right steps and a bit of consistency, you can make smarter content decisions, reach the right audience, and stay in control of your progress. So take your time, explore the tools, and let the numbers guide your next move.
Frequently Asked Questions (FAQs)
Is LinkedIn Analytics free?
Yes, LinkedIn offers free analytics for both personal profiles and company pages. If you’re looking for advanced features like detailed view tracking, tools like ViewMetrics may come with paid options.
Can I track LinkedIn Analytics without a company page?
Absolutely. Even if you’re using a personal profile, you can still see basic analytics. This includes things like how many people saw your posts, how often your profile showed up in searches, and who viewed your profile.
How often should I check LinkedIn Analytics?
It’s a good habit to check your analytics weekly to get a sense of what’s working in the short run. A monthly check helps you spot long-term trends and adjust your strategy if needed.
Does LinkedIn Analytics show who viewed my posts?
Not exactly. LinkedIn tells you how many people viewed your post and some general info about them, like job title or location. But it doesn’t show specific names to protect user privacy.
Can I download my LinkedIn Analytics data?
Yes, if you manage a company page, you can export your analytics data. This is useful if you want to study the numbers more deeply or share them with your team.
Are there any limitations to LinkedIn’s built-in analytics?
Yes, there are a few. For example, you can’t go back more than a year in your data, and you don’t get a lot of insights about your competitors. If you need more detailed reports or long-term tracking, third-party tools can fill those gaps.
How can I improve my LinkedIn analytics?
Start by focusing on quality content that speaks to people, not just algorithms. Use strong headlines, add eye-catching visuals like photos or videos, and make sure to reply to comments and engage with your audience. Posting regularly at the right times also helps boost your numbers over time.

