Key Takeaways
- Click-Through Rate (CTR): The global average for Sponsored Content is 0.44% to 0.65%. Image Ads are top performers at 0.61%, while Carousel Ads are around 0.40%.
- Cost Per Click (CPC) & Cost Per Lead (CPL): The global average CPC is notably high, ranging from $5 to $7. CPL has a wide range, from $15 to $350, depending heavily on the industry and target offer.
- Engagement Rate: The overall average engagement rate falls between 0.5% and 1.0%. Video Sponsored Content performs significantly better, averaging 1.6%.
- Optimization Strategy: To improve performance, marketers should consistently monitor and compare their metrics to these benchmarks, perform A/B testing on creatives/CTAs, and use audience segmentation for tailored messaging.
Running ads on LinkedIn in 2025? Knowing how your campaigns stack up is key. Benchmark data helps you understand what’s normal, so you can spot what’s working and fix what’s not.
In this blog, we’ll break down the latest LinkedIn Ads benchmarks for key metrics like click-through rate (CTR), cost per click (CPC), cost per thousand impressions (CPM), and conversion rate (CVR). Whether you’re new to LinkedIn Ads or optimizing an existing strategy, these numbers will help you make smarter decisions in the year ahead.
Understanding LinkedIn Ads Benchmarks
LinkedIn Ads benchmarks give you a baseline to measure your campaign performance. They show the average results other advertisers are seeing, like how often people click, how much they pay per click, and how many convert. By comparing your results to these benchmarks, you can quickly tell if your ads are underperforming, on track, or ahead of the curve.
Related Read – Master LinkedIn KPIs for Maximum Engagement and Growth!


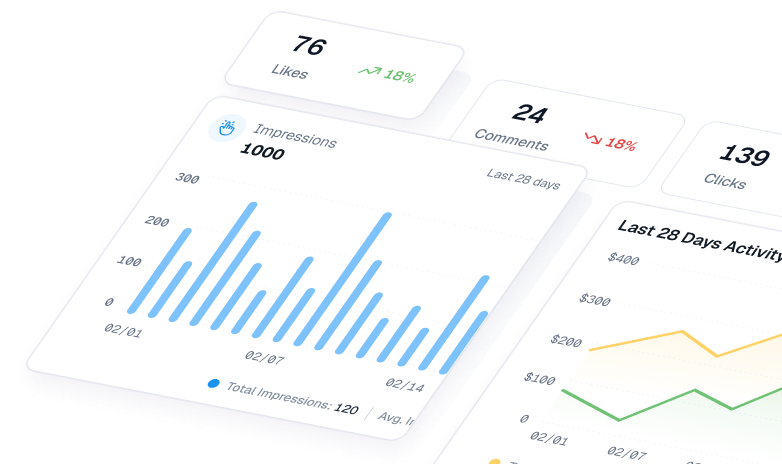
View All Your Marketing and Website Data - Instantly
 Connect Instagram, Mailchimp, Google Analytics & more
- Pre-built dashboards, no setup needed
- Save hours on reporting every week
LinkedIn Ads Benchmarks 2025
To get the most out of your LinkedIn ad campaigns in 2025, it’s important to know how your metrics compare to industry averages. Let’s take a closer look at Click-Through Rate (CTR), a key indicator of ad engagement.
-
CTR (Click-Through Rate)
Benchmark CTR for LinkedIn ads shows how often people who see your ad actually click on it. A higher CTR usually means your ad is catching attention and your message is resonating with the right audience.
According to data from AgencyAnalytics, The B2B House, and Huble, here are the average CTRs across different LinkedIn ad formats:
- Sponsored Content (overall): The global average CTR ranges between 0.44% and 0.65%. This includes a mix of all ad formats and gives a general idea of what’s considered a strong performance.
- Image Ads: These are among the top performers, with a global average CTR of 0.61%. Static visuals paired with concise, value-driven messaging tend to work well for B2B audiences.
- Carousel Ads: With a CTR around 0.40%, carousel formats offer a more interactive experience but typically result in lower click-through rates compared to single-image ads.
- Video Ads: Averaging a CTR of 0.44%, video content can help with brand awareness, but engagement tends to vary depending on the content and target audience.
Tip: If your CTR is below these averages, it might be time to refresh your ad creative, test new formats, or refine your audience targeting.
-
CPC (Cost Per Click)
CPC tells you how much you’re paying each time someone clicks on your LinkedIn ad. It’s a key metric for budgeting and understanding the cost-effectiveness of your campaigns.
According to data from Huble and Speedwork Social, the LinkedIn ads CPC benchmark globally ranges between $5 and $7. This is notably higher than other platforms like Facebook or Google, but that’s because LinkedIn targets a professional, B2B audience, which often means better lead quality.
Tip: If your CPC is much higher than this range, try narrowing your audience, improving ad relevance, or testing different ad formats to lower costs while maintaining quality traffic.
-
CPL (Cost Per Lead)
CPL measures how much you’re spending to generate a lead through your LinkedIn Ads. It’s one of the most important metrics for B2B marketers focused on lead generation.
According to The B2B House and Getuplead, the average CPL on LinkedIn ranges from $15 to $350 globally. This wide range depends heavily on your industry, target audience, offer, and funnel stage.
- Lower CPLs (closer to $15–$100) are typically seen in broader awareness campaigns or lower-competition industries.
- Higher CPLs (up to $350 or more) are common in high-value industries like software, legal, or enterprise B2B, where customer lifetime value is much greater.
Tip: To lower your CPL, test lead gen forms, simplify your offer, and make sure your targeting is as specific as possible to reach the right decision-makers.
-
Engagement Rate
Engagement rate measures how users interact with your ad through likes, shares, comments, and clicks, and gives insight into how relevant and appealing your content is.
Based on insights from The B2B House and Speedwork Social, the average engagement rate for LinkedIn ads falls between 0.5% and 1.0%. Sponsored content that’s visually engaging, clearly written, and targeted well tends to perform on the higher end of this range.
- Strong creatives and clear calls-to-action (CTAs) are key drivers of engagement.
- Formats like carousel and video ads often see higher engagement compared to static image ads due to their interactive nature.
Tip: Boost engagement by using scroll-stopping headlines, speaking directly to your audience’s pain points, and testing different ad formats.
-
CPM (Cost Per 1,000 Impressions)
CPM tells you how much you’re paying for every 1,000 views of your LinkedIn ad. It’s a useful metric for brand awareness campaigns where the goal is visibility rather than direct action.
According to Getuplead and Speedwork Social, the average CPM on LinkedIn is around $33.80. This is higher compared to platforms like Facebook or Instagram, but it reflects LinkedIn’s professional audience and precise B2B targeting capabilities.
Want to understand impressions better? Learn what impressions mean on LinkedIn here.
-
Engagement Rate
Engagement rate measures how actively users interact with your LinkedIn ads through clicks, likes, comments, and shares. It’s a key indicator of how relevant and compelling your content is to your target audience.
Based on insights from Getuplead, AgencyAnalytics, The B2B House, and Sprinklr:
- Non-video Sponsored Content typically sees an average engagement rate of 0.5%.
- Video Sponsored Content performs better, with an average engagement rate of 1.6%.
This shows that video formats generally generate more interest and interaction on LinkedIn, making them a smart choice for brands aiming to boost engagement.
-
Conversion Rate
Conversion rate is one of the most important LinkedIn Ads metrics; it tells you how many users took a desired action after clicking your ad, like filling out a form or downloading a resource.
According to insights from Speedwork Social and Sprinklr, the average conversion rate on LinkedIn ranges between 5% and 15%.
This wide range depends on factors like your offer, landing page experience, audience targeting, and ad format. High-performing campaigns often combine strong messaging, clear CTAs, and audience relevance to land in the upper end of that benchmark.
Leveraging LinkedIn Ads Benchmarks for Success
Understanding LinkedIn Ads benchmarks is only the first step. The real value lies in how you apply these insights to improve campaign performance. Here’s how you can turn benchmark data into a competitive advantage:
-
Regular Monitoring and Analysis
Keeping a close eye on your LinkedIn ad performance is essential. Compare your CTR, CPC, CPL, and conversion rates against industry benchmarks regularly. This helps you identify underperforming campaigns early and make informed decisions backed by data, not guesswork.
-
A/B Testing and Optimization
Benchmarks offer a target to aim for, but experimentation helps you get there. Run A/B tests with different creatives, headlines, CTAs, and formats. Use your test results to optimize based on what resonates best with your audience, ultimately improving engagement and ROI.
-
Audience Segmentation
Not all audiences respond the same way. Break down your targeting by job title, industry, company size, or location. Segmenting your audience allows you to tailor messaging, improve relevance, and raise engagement rates, helping you get closer to or exceed benchmark numbers.
-
Quality, Creative, and Landing Pages
High-quality visuals, compelling copy, and strong CTAs make your ad stand out in a professional feed like LinkedIn’s. But your landing page matters just as much. Ensure it’s fast-loading, mobile-optimized, and aligned with the ad’s promise to keep conversion rates high.
By combining these strategies with benchmark insights, marketers can build smarter, more efficient LinkedIn campaigns that not only meet industry standards but surpass them.
Common Reasons Your LinkedIn Ads Underperform
If your campaigns fall below LinkedIn’s 2025 benchmarks, one or more of these issues may be the cause:
- Your audience is too broad or too small
- Your creative isn’t relevant or visually compelling
- Weak or unclear call-to-action
- Landing page mismatch (message inconsistency)
- Insufficient data for LinkedIn’s algorithm to optimize
- Bidding too low for competitive industries
- Overlapping audiences causing internal competition
Identifying these gaps early helps you improve performance quickly.
LinkedIn Ads benchmarks for 2025 offer valuable insights into what successful campaigns look like, from average CTR and CPC to engagement and conversion rates. By regularly comparing your performance against these benchmarks, you can identify gaps, fine-tune your strategy, and optimise for better results. But remember, benchmarks are guides, not limits. With consistent testing, audience targeting, and high-quality creatives, you can push beyond averages and achieve standout success on the world’s leading B2B advertising platform.
Frequently Asked Questions (FAQs)
Why is LinkedIn Ads CPC so high?
LinkedIn reaches highly targeted B2B professionals, which increases cost but results in higher-quality leads compared to consumer platforms like Facebook.
How can I lower my LinkedIn CPC?
Use tighter audience targeting, improve ad relevance, test different formats, and refresh your creatives frequently.
What ad format performs best on LinkedIn in 2025?
Single-image ads still deliver the highest CTR, while video ads generate the highest engagement.
How often should I update my LinkedIn ad creatives?
Every 3–4 weeks to prevent ad fatigue and maintain strong CTR and engagement.
What affects LinkedIn conversion rates the most?
Strong offer, high-quality landing page, message consistency, and precise targeting.
Are Lead Gen Forms better than landing pages for conversions?
Yes. LinkedIn Lead Gen Forms typically convert 2–3× higher thanks to autofill and seamless user experience.