Summary for the Blog
- What are LinkedIn KPIs? Key Performance Indicators (KPIs) are measurable metrics used to evaluate the effectiveness and impact of your LinkedIn activities.
- Why monitor them? Tracking KPIs helps you compare your performance to competitors, understand how your audience engages with your brand, establish thought leadership, and ensure a high return on investment (ROI).
- Top 8 KPIs: The most important KPIs to track are Page/Profile Views, Click-through Rate (CTR), Cost Per Conversion, Reach & Impressions, Follower Growth Rate, Follower Demographics, Engagement Rate, and Conversion Rate.
- How to monitor with ViewMetrics: The blog mentions ViewMetrics is a tool that provides real-time insights, automated reporting, and AI-driven analytics to help monitor these KPIs.
In 2026, LinkedIn remains the #1 B2B platform with over 1 billion professionals. But posting consistently isn’t enough — you need to track the right LinkedIn KPIs (Key Performance Indicators) to prove ROI, refine strategy, and outperform competitors.
KPIs for LinkedIn measure everything from audience growth to lead quality. This complete 2026 guide gives you the top 10 LinkedIn KPIs, exact formulas, real-world benchmarks, and step-by-step tracking instructions — plus how ViewMetrics makes it effortless.
Whether you’re a marketer, sales leader, or founder, these metrics turn your LinkedIn activity into measurable business results.
What are LinkedIn KPIs?
Measurable parameters called LinkedIn Key Performance Indicators (KPIs) are used to evaluate the impact and efficacy of your LinkedIn activity. These measurable metrics give you information about how well your content is doing and how well your target audience responds to it. These are some of the important Social media KPIs that provide crucial insight into your overall approach.
Why You Must Monitor LinkedIn KPI Metrics?
To maximize your networking, engagement, and lead generation, it is essential to comprehend and monitor LinkedIn KPIs. Here are a few important reasons:
-
Determine Your Position Compared to Your Competitors
You can learn more about how you are doing in comparison to your competition by keeping an eye on your KPIs. It gives you the ability to modify your tactics in order to preserve or strengthen your market position.
-
Understand How Customers Engage With Your Brand
By analyzing client interactions, KPIs enable you to determine the kinds of content that your audience responds to the most. These kinds of findings can effectively direct your future content efforts.
-
Thought Leadership
You may assess how well your content positions you or your company as a thought leader in your sector by tracking LinkedIn marketing metrics. It indicates whether your observations are becoming more popular.
-
Provide the Highest Possible ROI
You can make sure that every dollar you spend is generating real engagement and conversion by comparing your investment to your results using these indicators. This way, these KPIs maximize return on investment.
The Top 8 LinkedIn KPIs to Monitor
You must concentrate on particular KPIs if you want to advance your LinkedIn approach. The top eight LinkedIn KPIs that can help you succeed are as follows:
-
Views on a LinkedIn Page or Profile
This indicator shows how frequently people view your LinkedIn profile or page. High page views indicate strong interest in your brand and its content. Keeping an eye on trends can also help you assess how well your marketing campaigns are working.
Definition: Visits to your Company Page or personal profile.
Benchmark: 500–5,000 monthly for growing pages.
Increase them by optimizing your profile and sharing employee-generated content. -
CTR, or Click-through Rate
The percentage of users who click on a link relative to the total number of people who visit your post is represented by the CTR. A higher CTR suggests that your content is intriguing and motivating users to explore further. Generally, a good CTR for LinkedIn content is around 1%.
Formula: (Clicks / Impressions) × 100
Benchmark: 0.8–2% Improve with compelling headlines and clear CTAs in your posts.
Improve with compelling headlines and clear CTAs in your posts.
Also Read: How to Calculate Impression to Conversion Percentage? -
The Price Per Conversion
This KPI lets you know how much you are spending on LinkedIn client acquisition. While a high cost-per-conversion can necessitate reevaluating your content strategy, a low one suggests that your targeting and engagement techniques are working.
Cost Per Conversion Formula: Total Ad Spend / Conversions
Benchmark: $30–$150 for B2B campaigns.
Lower it by refining targeting and A/B testing creatives. -
Reach & Impressions
Reach in LinkedIn indicates the number of distinct users who have viewed your content, whereas impressions in LinkedIn show how frequently they are presented. When combined, these indicators provide you with an idea of how widely your material is being shared.
Definition (Reach): Unique users who saw your content.
Benchmark: 10K–100K+ per post for mid-size pages.
Improve by posting at peak times and using relevant hashtags.Definition (Impression): Total times content was displayed.
Benchmark: Usually 2–5× your reach.
Boost impressions by encouraging employee shares and running targeted ads.
Also Read: What Are the Differences Between Reach and Impressions? -
Growth Rate of Followers
The growth rate is a critical LinkedIn KPI through which followers can give you important information about how well your target audience receives your material. A consistent rise indicates that your tactics are working; however, a stall indicates that new methods are required.
Formula: ((New Followers – Lost) / Starting Followers) × 100 (monthly)
Benchmark: 2–5% for active B2B pages. Improve it with consistent posting and employee advocacy programs. -
Demographics of Followers
You can better adapt your material to your audience’s interests and strengths by knowing the demographics of your followers, including their industries, job functions, and geographic areas. This ensures that your content is relevant.
-
Rate of Engagement
In relation to your followers or impressions, the engagement rate calculates interactions. Some of the LinkedIn KPI examples of engagement are likes, comments, and shares on your post. The engagement rate functions as a quality meter to evaluate how well your audience is responding to your material. It is valuable and relatable if your interaction rate is high.
-
Conversion Rate
Lastly, the conversion rate measures the proportion of site visitors who complete a desired action, such as buying a product or subscribing to a newsletter. Monitoring this KPI guarantees that your LinkedIn tactics produce measurable results.
Related Read – 7 Powerful LinkedIn Marketing Tips to Grow Your Business
How Can You Monitor LinkedIn KPIs Using ViewMetrics?
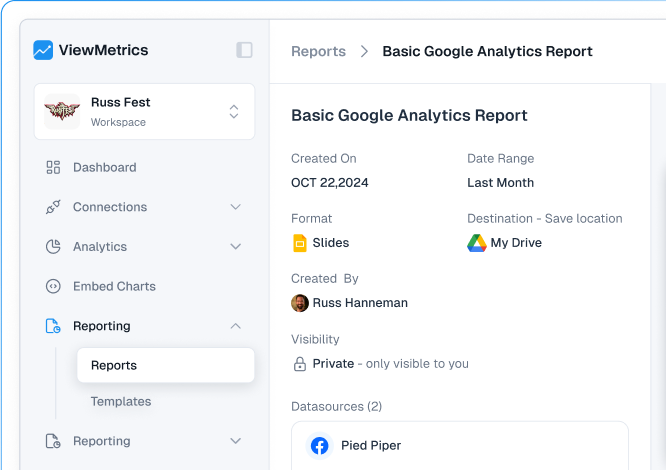
ViewMetrics is here to help you monitor LinkedIn metrics! It offers real-time insights into important KPIs that are crucial for maximizing the visibility, interaction, and lead generation of your brand. Moreover, it streamlines this procedure through automated reporting.
ViewMetrics compiles all-important LinkedIn statistics into one user-friendly dashboard, allowing you to track post engagement, follower growth, and lead conversion rates. You can see patterns, hone your content strategy, and make data-driven decisions that produce outcomes using AI-driven analytics and customizable reports.
Additionally, by providing concise, useful data about your LinkedIn performance, ViewMetrics makes sure you stay ahead of the game. With this tool, you can quickly adjust your strategies based on data, not guesswork.

Stop guessing what’s working. Track these 10 LinkedIn KPIs, apply the formulas, and watch your engagement, leads, and revenue grow. The difference between good and great LinkedIn performance is measurement.
They act as a compass, making sure you are not just creative but also well ahead of the competition!
Explore – Customizable Linkedin Performance Analytics Report Template
How ViewMetrics Helps with Specific Needs
- For LinkedIn KPIs: It pulls LinkedIn data into dashboards and reports, making it easier to track engagement, reach, impressions, follower growth, and other metrics without manual exports.
- For Reach vs Impressions: As part of broader social/ad analytics, it helps visualize and compare these metrics across platforms in one view.
- For agencies: Ready-made templates, client workspaces, and automated refreshes make client reporting much faster and more professional.
Frequently Asked Questions (FAQs)
How can I increase the page views of my LinkedIn profile?
Make sure your profile is complete and updated frequently to increase views. To improve your visibility, provide interesting content and make active connections with other users in your industry.
How can I raise my rate of engagement on LinkedIn?
Use popular hashtags, share insightful and engaging material, and stay in constant contact with your followers to increase engagement.
How can my KPI for LinkedIn be benchmarked?
By evaluating your previous performance trends or comparing current measurements to industry averages, you can benchmark your KPIs.
What constitutes a strong LinkedIn Ads CTR?
For LinkedIn advertising, a reasonable CTR typically falls between 0.39% and 0.65%, although anything over 1% is regarded as remarkable.
What are some typical causes of low views on LinkedIn posts?
Low post views could be caused by a number of factors, such as your network’s lack of interaction or material that is inappropriate for the platform and its target audience.
What is a good engagement rate on LinkedIn in 2026?
3–6.6% is considered strong for B2B pages. Carousel and video posts often perform at the higher end.
How do you calculate follower growth rate on LinkedIn?
Use this formula monthly: ((New Followers – Lost) / Starting Followers) × 100.
Are impressions or reach more important on LinkedIn?
Both serve different purposes. Reach helps you grow your audience while impressions show how often your message appears.
What tool tracks LinkedIn KPIs automatically?
ViewMetrics gives you all 10 KPIs in one clean dashboard with alerts, competitor data, and easy export options.

 Connect Instagram, Mailchimp, Google Analytics & more