If you’re not properly measuring how a website is performing, you’re simply guessing what’s working. The right website KPIs help you drive better marketing results, understand audience behavior, track conversion patterns, and assess the overall health of your site.
What Are Website KPIs?
KPIs (Key Performance Indicators) are measurable values that help you understand how effectively your website is achieving its goals. In other words, they turn your performance data into actionable insights.
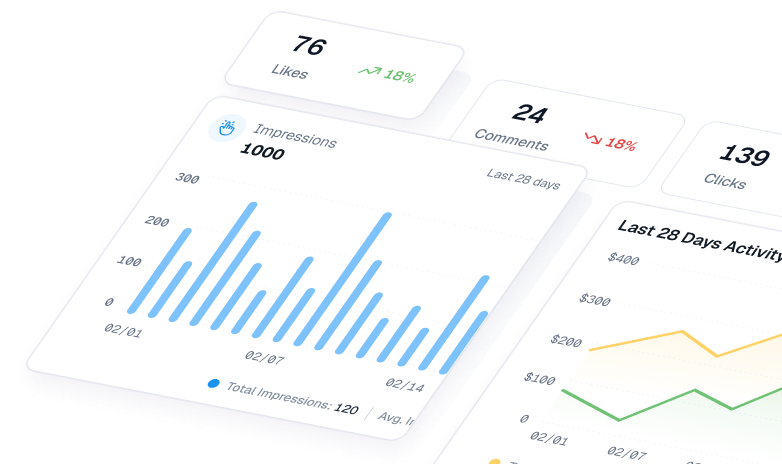
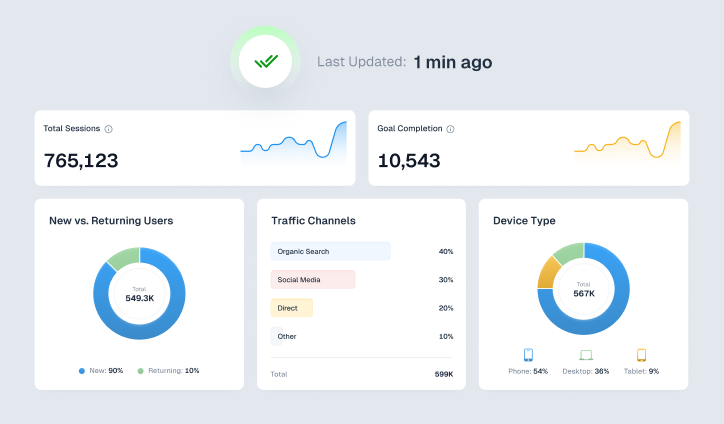
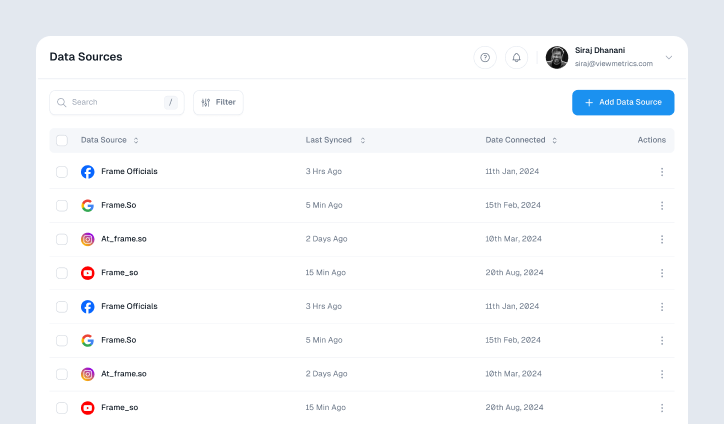
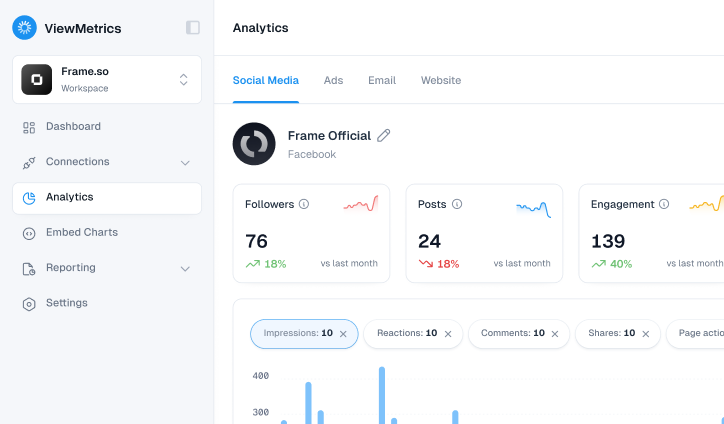
You can track them easily using a KPI dashboard that consolidates your metrics from multiple tools like Google Analytics, Facebook, and LinkedIn, helping you visualize performance all in one place.
Vanity Metrics vs. Actionable KPIs
Before we dive into which KPIs to track, you should be aware that not all metrics are created equal.
Vanity metrics (like total page views) may look impressive, but they don’t always correlate with conversions or engagement. In contrast, actionable KPIs (like conversion rate or cost per lead) show whether your website is truly driving results and revenue.
That said, the type of website KPIs you should be paying attention to varies based on the type of business. For example, a B2B company might prioritize lead generation KPIs, while an eCommerce business focuses more on transactions and conversion value. Choosing the right KPIs ensures you’re tracking metrics that reflect your business model and objectives.
18 Website KPIs You Should Track for Best Results
Below are 18 key website KPIs you should monitor regularly, along with how to track them and why they matter:
-
Total Users
Total users refers to the total number of individuals, unique devices, or browsers who visited your website in a given period. Many analytics platforms report this as “Users”.
How to track:
- Start by defining what counts as a “user” for your site, for example, someone who visits a page, logs in, or completes a purchase.
- Next, set your preferred time range (daily, weekly, or monthly). GA4 and similar analytics platforms will automatically calculate Total Users for that period, based on unique activity identifiers.
- You can view this data in the Reports → Audience → Overview section.
Why to track:
- Total Users gives you the broadest reach measure of your website.
- It shows how many people your site attracted in absolute terms.
- If this number is growing, your visibility and traffic efforts are working. If it’s flat or falling, you may need to boost promotion, SEO, or other traffic sources.
- It also provides the base for other metrics.
-
Unique Website Visitors
Unique Visitors represent the number of distinct individuals who visit your website within a specific time frame. Unlike Total Users or total visits, which may count the same person multiple times, this key metric for your website only counts each visitor once, no matter how often they return.
How to track:
You can track Unique Visitors using tools like Google Analytics 4 (GA4), which identifies users through cookies or unique device IDs.
- In GA4: Head to Reports → Audience → Overview to see how many individual users have engaged with your site during a given period.
Why to track:
- This metric tells you how many new people are discovering your website, or at least appearing as new in your analytics.
- It’s important because a healthy website often needs both new visitors to grow its reach and returning visitors to build loyalty.
- If unique visitor numbers stagnate, you may be failing to attract fresh audiences.
-
Sessions
This website KPI records the period of interaction a user has with your website. For example, the period a user is active until they leave or become inactive for a certain timeout.
How to track:
In GA4: Reports → Engagement → Sessions. You can segment by source, landing page, device, etc. Also, check “Sessions Per User” to understand website visitor behavior.
Why to track:
- Sessions help you understand the volume of visits, rather than just unique users.
- Many users may visit frequently, so session growth signals engagement or repeated visits.
- Tracking sessions also helps you compare performance across time, channels, or campaigns, and establish whether user behavior is consistent or changing.
-
Traffic by Source
Traffic by Source breaks down where your website visitors are coming from, like organic search, paid search, direct, referral, social, or email.
How to track:
- In GA4: Reports → Acquisition → Traffic acquisition.
- Use “Session source/medium” or “Default channel grouping”.
- Filter or segment to see each source.
Why to track:
- Tracking traffic by source helps in allocating marketing budget.
- With this website KPI, you can properly identify which channels drive growth and which ones may require improvement. For example, if organic traffic is flat but paid traffic is rising, you might want to shift focus.
-
Organic Traffic
Organic Traffic refers to visitors who reach your website via unpaid search engine results. This includes normal search listings and not paid ads.
How to track:
- In GA4: Navigate to Acquisition → Traffic Acquisition → filter out Organic Search.
- In Google Search Console: Go to Performance → filter by Search Traffic.
Why to track:
- Organic traffic reflects how well your SEO and content strategy are working to capture search intent and drive discovery.
- It tends to be lower-cost compared to paid in the long run.
- If organic traffic grows steadily, it signals sustainable growth. If it stagnates or drops, it may indicate SEO issues, algorithm changes, or competitive shifts.
- Tracking this KPI for your website helps you gauge visibility in search engines and the effectiveness of your organic approach.
-
Referral Traffic
Referral Traffic is traffic that arrives at your site via links from other websites. In other words, it is a website KPI that shows when someone clicks a link on another site and lands on your site.
How to track:
- Go to the total number of visitors for your selected time period.
- Navigate to Reports → Acquisition → Traffic Acquisition.
- In the table, look for the Referral channel group or switch the dimension to Session source/medium and filter for “referral” sources.
- Apply the formula: Referral Traffic = Total Referral Traffic ÷ Total Website Traffic × 100
Why to track:
- Referral traffic shows how well your content, partnerships, PR, backlinking strategy, or external mentions are driving traffic.
- High-quality referral traffic often brings engaged visitors because they came via a trusted link, signaling strong brand authority and third-party endorsement.
- Low referral numbers may mean you need to ramp up link-building or external content promotion.
-
Top Landing Pages
This website KPI is the first page users see when they arrive on your website. A landing page is the entry point of a session. Tracking the top ones helps you see which pages are most effective at attracting traffic.
How to track:
- In GA4: Navigate to Reports → Engagement → Landing Page.
- You can also adjust the date range to analyze performance over a specific period for better analysis.
Why to track:
- Understanding which pages are your most common entry points is crucial to optimizing user experience, navigation, and conversion paths.
- If a high-traffic landing page has poor engagement or conversion metrics, you know you must optimize it.
- It also helps you focus content updates and link-building on the pages that matter most.
-
Average Time on Page
Average Time on Page is the average amount of time users spend on a specified page before navigating away.
How to track:
-
Method 1 – Manual Calculation:
Head to Explore → Blank Report, add Average Session Duration and Views per Session as metrics. Then, divide the session duration (in seconds) by the views per session to estimate the average time on page.
-
Method 2 – Use Average Engagement Time:
This GA4 metric measures how long users actively engage with your site.
Search for “Average Engagement Time” in the GA4 search bar for a quick snapshot.
Why to track:
- If users spend more time on a page, it suggests interest, relevance, and possibly deeper reading or interaction.
- If the time is very low, it may signal content not meeting expectations or user experience issues.
- For content-rich B2B sites, this is particularly important.
-
-
Engagement Rate
Engagement Rate is the percentage of sessions that include meaningful interactions such as scrolling, clicking, or conversions.
How to track:
- In GA4: Reports → Engagement → Pages and Screens.
- Click Customize Report → Metrics → Add Metric → search for “Engagement Rate”.
Why to track:
- Engagement rate reflects quality interactions.
- High engagement correlates with better conversion potential.
- Low engagement may indicate UX or relevance issues.
-
Bounce Rate
This website KPI is the percentage of visitors who enter your website and leave without viewing another page or taking action.
How to track:
Bounce Rate = Single-Page Sessions ÷ Total Page Entries × 100
Example: 1,000 entries and 500 single-page sessions = 50% bounce rate.
Why to track:
- Signals landing page relevance and engagement.
- High bounce may reflect slow load time, poor UX, irrelevant content, or wrong audience targeting.
- Interpret bounce in context—some pages naturally have high bounce.
-
Exit Rate
Exit rate refers to the number of users who leave your website from a specific page.
How to calculate:
Exit Rate = Exits ÷ Page Views × 100
Example: 600 views and 180 exits = 30% exit rate.
Why to track:
- Helps identify pages where users drop off.
- High exit on key funnel pages signals issues like poor content or unclear CTAs.
-
Conversion Rate
The Conversion Rate measures the percentage of visitors who complete a desired action such as a purchase or signup.
How to calculate:
Conversion Rate = Conversions ÷ Visitors × 100
Example: 60 conversions out of 1,200 visitors = 5%.
Why to track:
- A critical KPI linking website performance to outcomes.
- Essential for ROI, campaign decisions, and reporting.
-
Click-Through Rate (CTR)
Click-Through Rate (CTR) measures the percentage of users who click on a link compared to the number who see it.
How to calculate:
CTR = Clicks ÷ Impressions × 100
Example: 2,000 impressions and 100 clicks = 5% CTR.
How to track:
- In Google Search Console: Performance → Search Results.
Why to track:
- Shows how compelling your titles, descriptions, and CTAs are.
- High CTR indicates relevance; low CTR signals messaging or visibility issues.
-
Cost Per Conversion (CPC)
Cost per Conversion (CPC) measures how much you spend on marketing or advertising to generate one conversion.
How to calculate:
CPC = Total Ad Spend ÷ Total Conversions
Example: $1,200 spend with 60 conversions = $20 CPC.
Why to track:
- Reveals the efficiency of your campaigns.
- Helps compare costs across channels and campaigns.
- High CPC may require optimization.
-
Goal Completions/Number of Leads Generated
Goal completions represent how many times visitors complete desired actions like form submissions or downloads.
How to track:
- In GA4: Admin → Events → Create Event.
- Mark key actions as conversions.
- View them under Reports → Engagement → Conversions.
Why to track:
- Shows whether your website is effectively generating leads.
- Helps identify high-performing touchpoints and optimize conversion paths.
-
Cost Per Lead (CPL)
Cost per Lead (CPL) measures how much you spend to acquire one qualified lead.
How to calculate:
CPL = Total Marketing Spend ÷ Number of Leads Generated
Example: $2,000 spend generating 200 leads = $10 CPL.
How to track:
- Use Google Ads, LinkedIn Ads, or Meta Ads with conversion tracking enabled.
Why to track:
- Shows cost-efficiency of lead generation.
- Helps optimize budgets and compare channels.
-
Core Web Vitals
Core Web Vitals measure user experience related to loading, interactivity, and visual stability.
- Largest Contentful Paint (LCP)
- Cumulative Layout Shift (CLS)
- Interaction to Next Paint (INP)
How to track:
- Google Search Console → Core Web Vitals
- PageSpeed Insights or Lighthouse
Why to track:
- Google uses these as ranking signals.
- Poor performance increases bounce and hurts conversions.
-
Page Load Time
Page Load Time is the total time it takes for a page to fully load and become interactive.
How to track:
Use PageSpeed Insights or Lighthouse to analyze load performance and diagnose bottlenecks.
Why to track:
- Fast-loading sites improve engagement and conversions.
- According to Portent, a site loading in one second converts 3× higher than at five seconds.
How ViewMetrics Can Help You Track Website KPIs
Manual tracking of the core website KPIs is tedious, especially when all of your data is scattered across multiple tools and platforms. And ViewMetrics simplifies this process for you!
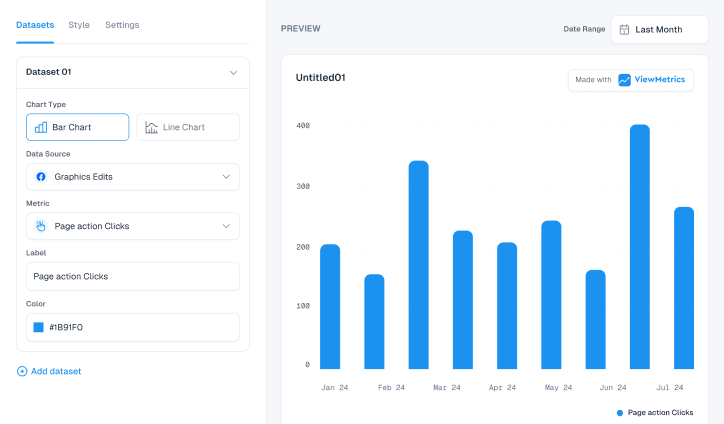
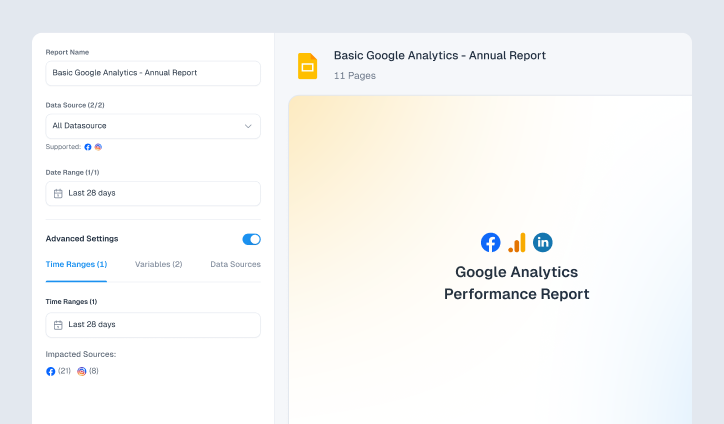
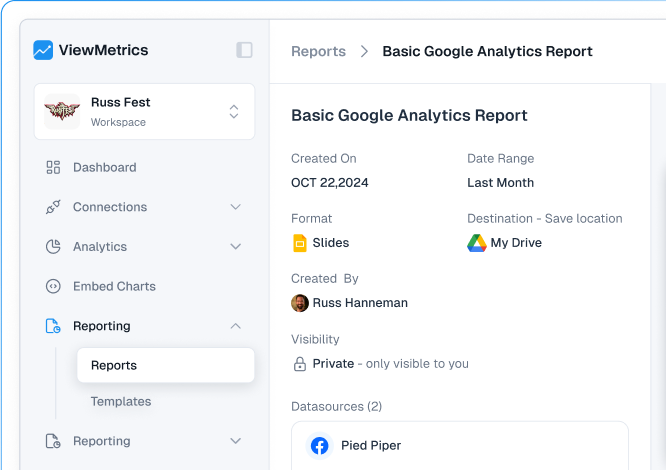
- With automated reporting, you can connect all your data sources, visualize performance in real time, and create custom dashboards in Google Sheets or Slides.
- We even offer pre-built templates for reporting, saving hours of repetitive work.
Get started with ViewMetrics today and make tracking your website KPIs effortless.
View All Your Marketing and Website Data - Instantly
Connect Instagram, Mailchimp, Google Analytics & more
Pre-built dashboards, no setup needed
Save hours on reporting every week
Conclusion
Tracking the right KPIs for a website helps you move from guesswork to growth. Whether you’re focused on B2B website KPIs or general traffic metrics, understanding what to measure and why is essential for long-term success.
FAQs
-
What are the best KPIs for a website?
The best website KPIs include traffic by source, conversion rate, bounce rate, cost per lead, page views, goal completions, and average session duration.
-
How do you measure website success?
To measure a website’s success, you need to track conversions, engagement, and overall user experience through a KPI dashboard or analytics tool.
-
What is an SEO KPI example?
Examples include organic traffic, keyword rankings, CTR, organic conversion rate, bounce rate, domain authority, page load speed, and ROI.
-
How often should I measure website KPIs?
Depending on your campaign activity and reporting needs, it’s ideal to track your website KPIs every week or month.
-
What are the necessary KPIs for B2B websites?
Essential B2B KPIs include lead generation, CPL, conversion rate, and CAC, along with traffic sources, engagement metrics, and customer retention rate.


