Summary for the Blog
- A marketing dashboard is a visual tool that displays key marketing data on a single screen, allowing for quick tracking of progress.
- There are two main types of dashboards: strategic, used for long-term planning, and operational, used for tracking daily tasks.
- Dashboards are crucial for tracking key metrics, making quick decisions, and improving the customer experience.
- Creating a dashboard involves defining goals and KPIs, connecting data sources, choosing visualizations, and regularly monitoring the dashboard’s performance.
Are you a marketer or business professional who finds it difficult to keep track of your marketing data? Are you looking for a simpler way to understand how your marketing efforts are performing? Then, marketing dashboards might be the solution.
In this guide, we’ll explain what marketing dashboards are, how they work, and why they can be helpful for your business. Whether you’re experienced in marketing or just starting out, this blog will give you the information you need to use data to make smart decisions and reach your marketing goals.
What is a Marketing Dashboard?

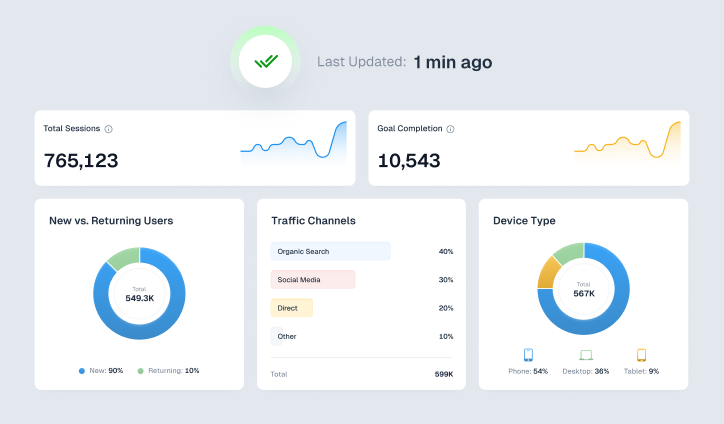
A marketing dashboard is a tool that visually displays important marketing information in an easy-to-understand way. It collects all essential marketing data on a single page, allowing marketers and managers to quickly check their progress. This helps them make informed decisions based on up-to-date metrics.
Typically, a marketing dashboard shows data like website visits, lead generation, conversion rates, and social media activity. It helps businesses track their marketing goals and ensure their efforts align with their overall business plans.
Just as a car’s dashboard shows what’s happening with the vehicle, a marketing dashboard provides a clear view of your marketing performance. It should be regularly updated and accessible to everyone in your organization, allowing for ongoing monitoring and timely adjustments to your plans.
Also Read – Dashboards vs Reports: Which one is right for your business?
What are the Types of Marketing Dashboards?
Marketing dashboards can be divided into two main groups: strategic and operational. Think of it like this: strategic dashboards are for planning and making important decisions, while operational dashboards are for keeping track of daily tasks and measuring results. Some dashboards specialize in one area, but many can do both.
-
Strategic Marketing Dashboards
These dashboards offer valuable insights that guide your marketing efforts. By showing you strategic analytical results, these tools ensure your marketing team is focused on the right activities and investing resources wisely. This type of dashboard provides predictive analytics to help your team anticipate future success.
For instance, a strategic marketing dashboard might accurately predict the conversion rates of potential customers in your sales funnel. This allows you to concentrate on leads most likely to become customers, accelerating overall revenue growth.
-
Operations Marketing Dashboards
Operations marketing dashboards give a quick look at how an organization is doing online. Unlike strategic dashboards that focus on future goals, these dashboards offer insights into past performance.
By collecting data from various online sources like websites, social media, and mobile apps, operations dashboards help businesses understand the effectiveness of each digital channel. Metrics such as reach and impressions provide valuable information about how different channels contribute to overall marketing success.
This data can be used to identify trends, correlations, and areas for improvement. By understanding the performance of each digital channel, businesses can make informed decisions to optimize their marketing strategies and achieve better results.
Importance of a Marketing Dashboard
Marketing dashboards make it easy to track important metrics, helping businesses make quick and smart decisions that drive growth. Teams that use these dashboards to set and monitor goals are significantly more likely to report success—376% more, to be exact.
These dashboards also play a crucial role in enhancing customer experience. Customer experience includes every part of your marketing and sales efforts and affects how customers see your brand, their interactions with you, and their loyalty.
By using data from your marketing dashboard, you can continually improve your strategies and interactions to better serve your customers.
Here’s how a marketing dashboard can boost your customer experience:
- Behavioral Data: Track user preferences to spot trends and tailor your future campaigns.
- Customer Churn Data: Find areas where you can improve to keep customers loyal and engaged.
- SEO Data: Discover what content your customers are searching for and create it.
- Website Analytics: Identify where customers drop off on your site and make those pages better.
These are just a few ways to use data to refine your marketing and improve your customer relationships. With a marketing dashboard, you can do this more quickly and accurately than with manual reporting.
What are the Core Components of a Marketing Dashboard?
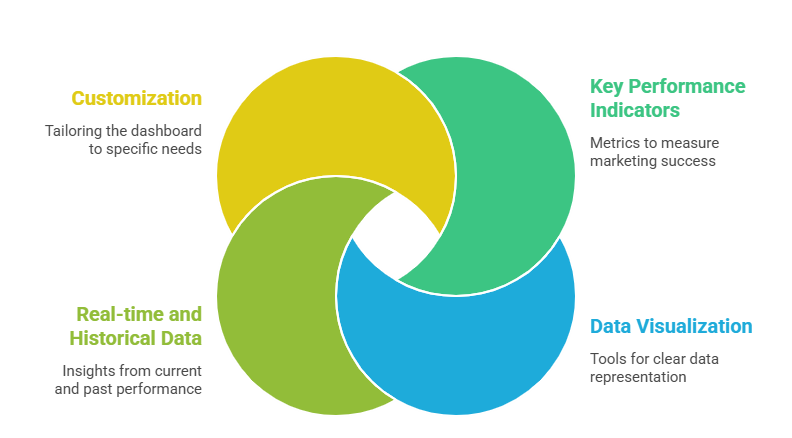
A marketing dashboard is a helpful tool that offers a clear overview of your marketing results. It lets you keep track of important numbers, spot trends, and make decisions based on data. To build a useful dashboard, you need these important parts:
-
Key Performance Indicators (KPIs):
These are the numbers that show how well your marketing is doing. The right KPIs depend on your marketing goals. Some popular ones include website visits, leads, conversion rates, social media activity, and return on investment (ROI).
-
Data Visualization:
Clear visuals are important for understanding marketing data. Charts and graphs can help you see trends, patterns, and unusual things more easily. Some common visual tools include line charts, bar charts, pie charts, and heat maps.
-
Real-time and Historical Data:
Both types of data are valuable. Real-time data lets you see your performance as it happens and make changes right away. Historical data gives you context and helps you see long-term trends.
-
Customization:
A customizable dashboard lets you tailor the tool to your specific needs. This means you can choose which KPIs to track, how to show the data, and how often the data is updated. Customization can help you create a dashboard that is informative and easy to use.
The Top Metrics to Track on Your Marketing Dashboards and Reports
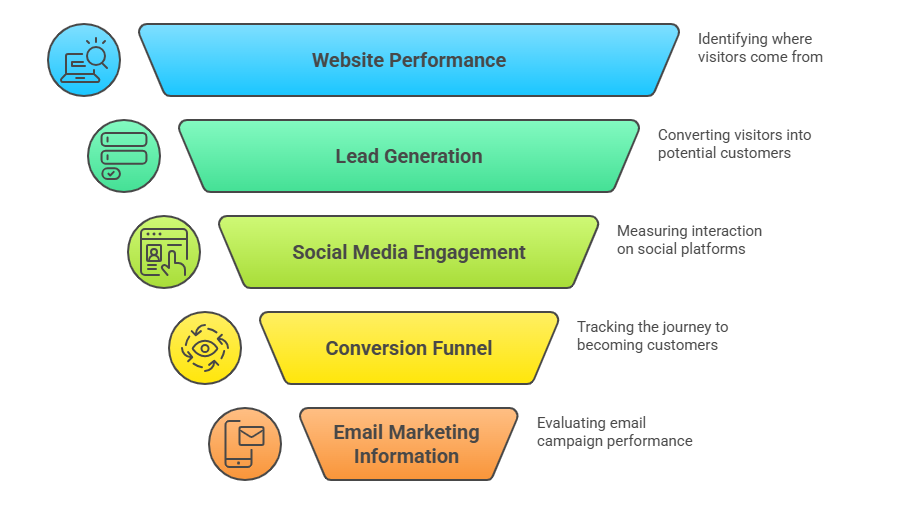
Here are the key things to track on your marketing dashboards and reports:
- Website Performance: Keep an eye on metrics like how many people visit your website, how often they leave without interacting, and how long they stay to see how well your site is doing.
- Traffic Sources: Find out where your visitors come from, whether it’s from search engines, ads, social media, other websites, or direct visits.
- Lead Generation: Track how many leads you’re getting and how often these leads turn into customers to measure how well your lead generation is working.
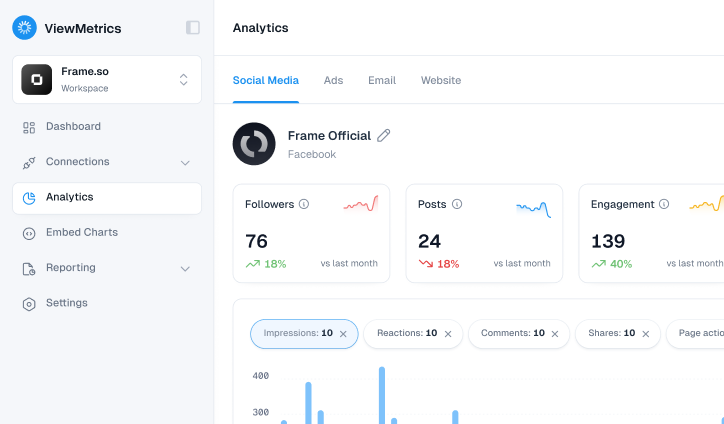
- Social Media Metrics: Look at how your social media posts are performing by checking likes, shares, comments, and the number of followers.
- Conversion Funnel: Follow the steps visitors take to become customers by tracking their progress through each stage of your sales process.
- Email Marketing Information: Check how well your email campaigns are doing by measuring open rates, click-through rates, and how often these emails lead to conversions. Read more on the Top 17 Email Marketing KPIs You Should Track.
How To Create a Marketing Dashboard?
To create a Marketing Dashboard, you must follow these steps:
-
Define Your Goals and KPIs:
The first step in creating a marketing dashboard is to clearly define your goals and key performance indicators (KPIs). What do you want to achieve with your marketing efforts? Once you’ve identified your goals, set specific, measurable, achievable, relevant, and time-bound (SMART) KPIs to track your progress.
-
Connect to Data Sources:
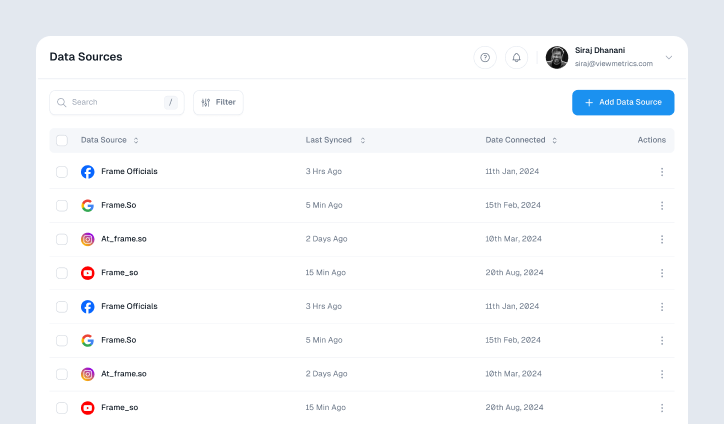
To fill your dashboard with meaningful data, you’ll need to connect it to various data sources. These can include your website analytics, social media platforms, email marketing tools, customer relationship management (CRM) systems, and other relevant marketing software.
-
Choose Data Visualization Types:
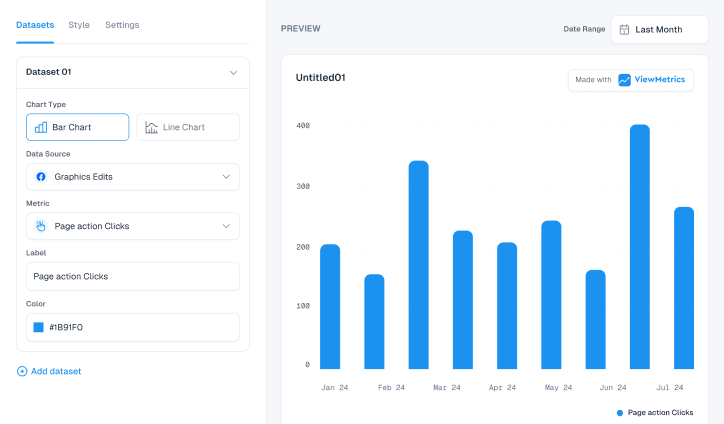
Select data visualization types that best show your important metrics. Consider using charts, graphs, tables, and other visual elements to make your data more understandable and engaging. Some popular visualization techniques include line charts, bar charts, pie charts, and heat maps.
-
Customize Your Dashboard:
Customize your dashboard to suit your specific needs and preferences. You can arrange elements, add filters, and personalize the appearance to make it visually appealing and easy to navigate.
-
Share Your Dashboard:
Once you’ve created your dashboard, consider sharing it with relevant stakeholders within your organization. This will enable them to stay informed about your marketing performance and make data-driven decisions.
-
Regular Monitoring and Analysis:
To get the most value from your dashboard, regularly monitor and analyze the data it presents. Look for trends, patterns, and insights that can help you optimize your marketing strategies and improve your overall performance.
Best Practices for Marketing Dashboard Utilization
-
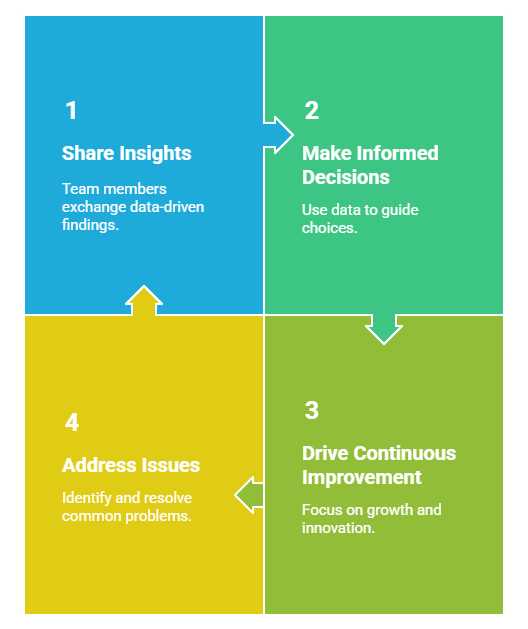
Share Insights with Your Team
Make sure to share what you learn from your dashboard with your team. This helps everyone stay on the same page with marketing goals and strategies.
-
Use Data to Make Decisions
Base your marketing decisions on the data from your dashboard. This helps you improve your campaigns and get better results.
-
Keep Improving
Regularly check and update your dashboard to make sure it matches your changing marketing goals and strategies.
-
Tackle Common Issues
Watch out for common problems like too much data, picking the right key performance indicators (KPIs), and making sure your data is accurate.
View All Your Marketing and Website Data - Instantly
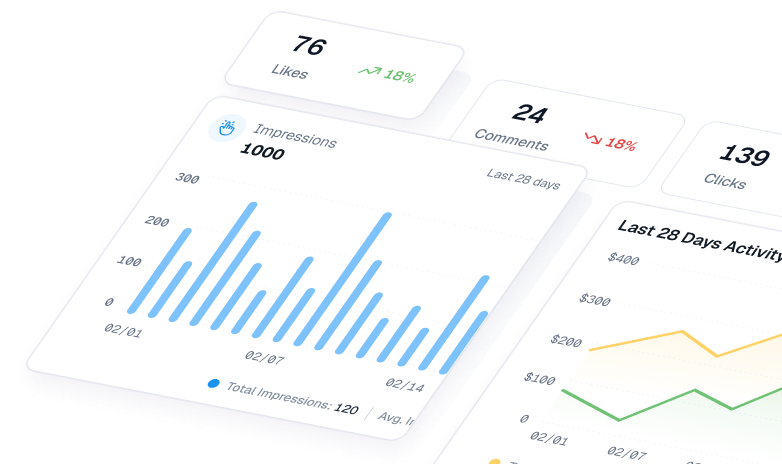
Connect Instagram, Mailchimp, Google Analytics & more
Pre-built dashboards, no setup needed
Save hours on reporting every week
Best Platforms for Getting a Marketing Dashboard
When setting up marketing dashboards, you have several tools to choose from, depending on what you need and your budget. Here are some popular options:
-
ViewMetrics
ViewMetrics is a cloud-based marketing analytics platform that offers a wide range of features, including real-time data tracking, custom reporting, and integration with popular marketing tools.
Key features:
- Detailed analysis of different marketing channels
- Custom reports and dashboards
- A/B testing options
- Integrates with popular marketing tools

-
Google Data Studio
This free tool from Google is a great option for those who are already familiar with Google Analytics. It allows you to connect to multiple data sources, create custom visualizations, and share your dashboards with others.
Key features:
- Simple drag-and-drop interface
- Lots of data connectors
- Customizable templates and widgets
- Works with Google Analytics and other Google tools
-
Tableau
Tableau is a powerful data visualization tool that can be used to create complex and interactive dashboards. It offers a drag-and-drop interface and a wide range of visualization options. However, Tableau can be a bit more complex to learn compared to other options on this list.
Key features:
- Interactive dashboards and visualizations
- Strong data blending capabilities
- Large user community
- Connects with various data sources
-
Power BI
Power BI is a business intelligence platform from Microsoft that offers a variety of features, including data discovery, data modeling, and report creation. It is tightly integrated with other Microsoft products, such as Excel and SharePoint.
Key features:
- Natural language queries
- Real-time data updates
- Works with Microsoft Office products
- Custom visualizations and templates
-
Qlik Sense
Qlik Sense is a data visualization tool that uses associative analytics to help users discover insights in their data. It offers a variety of features, including natural language search, self-service analytics, and mobile access.
Key features:
- Data exploration engine
- Natural language search
- Mobile app for analysis on the go
- Connects with various data sources
Factors to Consider When Choosing a Marketing Dashboard Tool
When choosing a tool, consider these factors:
- Ease of Use: The tool should be simple to set up and use, even if you’re not tech-savvy.
- Data Integration: Make sure the tool works well with your current marketing tools and platforms.
- Customization: It should allow you to adjust the dashboard to meet your specific needs.
- Cost: Pick a tool that fits your budget, whether it’s free or comes with a higher price tag
ViewMetrics fits perfectly for all your needs. Try it now by clicking below!
Closing Thoughts
Marketing dashboards offer a practical solution for tracking and understanding your marketing efforts. By consolidating important metrics and visualizing data in an accessible way, they empower you to make informed decisions quickly. Whether you’re aiming for strategic insights or daily performance tracking, a well-designed dashboard can be a game-changer in optimizing your marketing strategies and achieving better results.
Frequently Asked Questions About Marketing Dashboard.
-
Who can benefit from using a marketing dashboard?
Marketing dashboards are helpful for marketers, sales teams, executives, and anyone who wants to understand how well marketing efforts are performing.
-
What data sources can be integrated into a marketing dashboard?
Marketing dashboards can pull in data from different sources like website analytics, social media, email marketing tools, CRM systems, and paid ads.
-
How often should a marketing dashboard be updated?
How often you update your dashboard depends on your needs. Some might need daily updates, while others can be refreshed weekly or monthly.
-
What are some common mistakes to avoid when building a marketing dashboard?
Avoid putting too much information on the dashboard, using confusing visuals, and forgetting to set clear goals and key performance indicators (KPIs).
-
What is the difference between a marketing dashboard and a marketing report?
A dashboard shows a real-time view of key metrics, while a report gives a detailed analysis of specific data over a period of time.


