Key Takeaways
- Tracking follower growth helps you understand what content works and what doesn’t.
- LinkedIn’s built-in analytics offer useful insights for both personal and business profiles.
- Tools like ViewMetrics automate tracking and make reports easy to manage and share.
- Watching trends over time helps you post more consistently and plan better content.
- Comparing with competitors shows where you stand and where there’s room to grow.
Watching your LinkedIn follower count grow can feel exciting one day and frustrating the next. Some posts take off, others barely get noticed. It’s easy to feel stuck, especially when you’re putting in the effort but not sure what’s actually working. That’s where tracking comes in. When you start paying attention to the right LinkedIn KPIs, things start to make more sense. In this guide, we’ll take a clear look at how to track LinkedIn follower growth, so you can move forward with more clarity, less guesswork, and a better understanding of your audience.
Why Tracking Follower Growth Matters?
If you’re trying to build a presence online, keeping an eye on your follower count is important. Here’s why:
-
Measuring Marketing Effectiveness
When you run campaigns, post content, or try new strategies, your follower growth shows if those efforts are paying off. A steady rise often means your message is reaching the right people. If numbers stay flat, it might be time to rethink the approach. It’s a simple way to check how your marketing is doing without relying only on likes or comments.
-
Understanding Your Audience
Your followers say a lot about who’s interested in your content. Tracking growth helps you spot what type of posts attract new people and which ones don’t. You start to see patterns in who engages, when they engage, and what they want more of. This insight helps you shape content that actually connects with your audience.
-
Competitive Analysis
Keeping an eye on your own follower growth is important, but so is watching your competitors. Are they growing faster? Are they doing something you’re not? Comparing numbers helps you understand how you stack up in your industry and where you might be falling behind.
-
Identifying Trends
Tracking growth over time helps you spot trends. Maybe your numbers go up every time you post on a certain day, or when you use a specific type of content. These small clues help you build a smarter, more consistent content strategy. Instead of just guessing, you’re making decisions backed by real data.
How to Track Follower Growth on LinkedIn?
There are two main ways to track your follower growth on LinkedIn:
Method 1: Use LinkedIn’s Built-in Analytics Tools
LinkedIn has a solid analytics dashboard that’s free and available to all users. You can access it whether you’re running a company page or working with a personal profile. It’s straightforward and packed with useful insights. Here’s how you can get started:
Step 1: Open Your Analytics Dashboard
For Company Pages:
- Log into your LinkedIn account and go to your company page
- Make sure you have admin access
- Click the “Analytics” tab at the top of the page
- This will open LinkedIn’s analytics panel with six main sections
For Personal Profiles:
- Go to your profile
- Find and click on “Analytics & tools”
- Select “Audience analytics” to view your follower details
Step 2: Head to the Follower Section
Inside the analytics dashboard, you’ll find a section called “Followers.” This is where you’ll see how many people follow you and how that number has changed recently. Follower highlights include:
- Total followers since you created the page
- New followers in the past year
- Premium users can also view followers gained through invite tools
Step 3: Spot Growth Trends in Follower Metrics
In the follower metrics section, you can track how your follower count changes over time. Here you can access:
- Interactive graphs that show growth patterns
- Filters to select time frames like 7, 30, 90, or 365 days
- Options to compare organic versus sponsored growth
- Views to toggle between overall and detailed stats
All of this helps you figure out what’s working and what isn’t. You can see which content led to the biggest growth spikes and plan your future posts accordingly.
Step 4: Dig Into Follower Demographics
This is where things get really useful. LinkedIn shows you who your audience is through:
- Location: Where your followers are based
- Seniority: Their professional level (student, manager, director, etc.)
- Job Function: What kind of roles they’re in
- Industry: Which sectors they work in
- Company Size: From startups to large enterprises
This helps you figure out whether your content is reaching the people you want to connect with.
Step 5: See Who Is Following You
In the “All Followers” tab, you will see a list of your current followers. It shows their job roles and when they followed you. If you use a Premium Company Page, it also shows if they followed because of an auto-invite.
Step 6: Export the Data
If you want to do more detailed analysis or save your data, LinkedIn allows you to export everything. To do this:
- Click the “Export” button on the top right of any analytics section
- Select the date range
- Download the file in Excel format (.XLS)
This makes it easier to keep long-term records, share results with your team, or do custom comparisons in spreadsheets.
Step 7: Build a Habit of Regular Monitoring
Building a habit of regular monitoring can make a major difference in how you grow. Here’s what we recommend you to do:
Weekly Check-ins:
- Look at how many new followers you gained
- See which posts led to the biggest bumps
- Track engagement with recent content
Monthly Reviews:
- Analyze growth trends over the month
- Compare with previous months to spot patterns
- Review any demographic shifts
By doing this consistently, you’ll get a much clearer picture of what’s working. Over time, these insights can help you build a stronger brand presence on LinkedIn.
Method 2: Using ViewMetrics for Automated LinkedIn Analytics
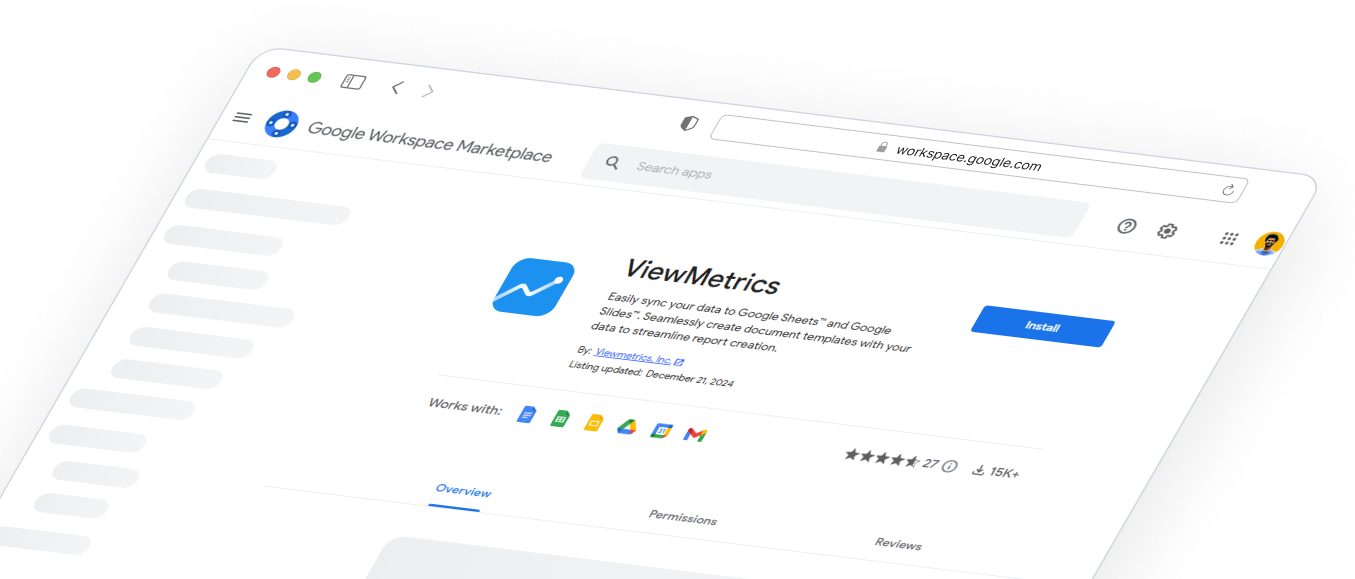
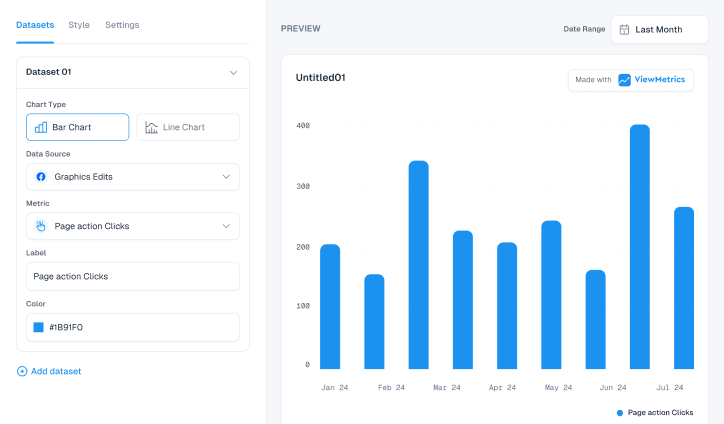
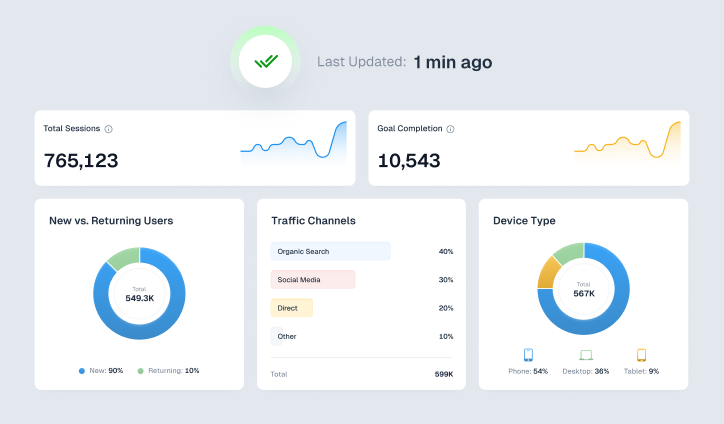
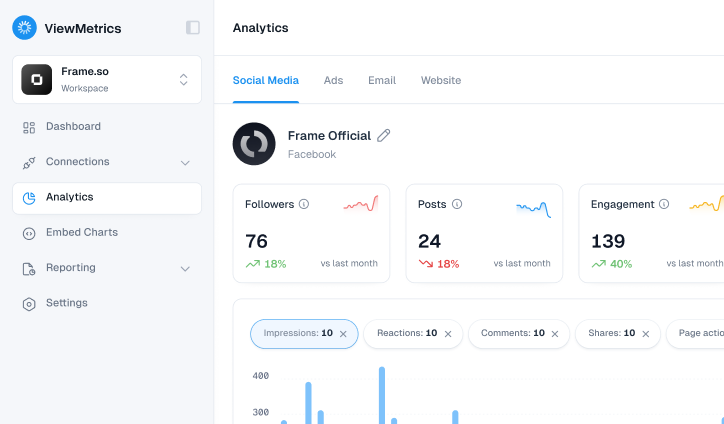
If you want to avoid the hassle of manual data exports and prefer something more streamlined, ViewMetrics is a great option. It helps you track your LinkedIn analytics automatically and gives you well-organized reports without much effort. This works especially well if you’re managing a business page and need regular updates for your team or stakeholders.
Step 1: Set Up Your ViewMetrics Account
- Start by visiting the ViewMetrics website. You can sign up for a new account in a few clicks.
- If you already have one, just log in to access your dashboard.
- There’s a free plan to explore, or you can go for a premium plan if you want more features and deeper access.
Step 2: Connect Your LinkedIn Business Page
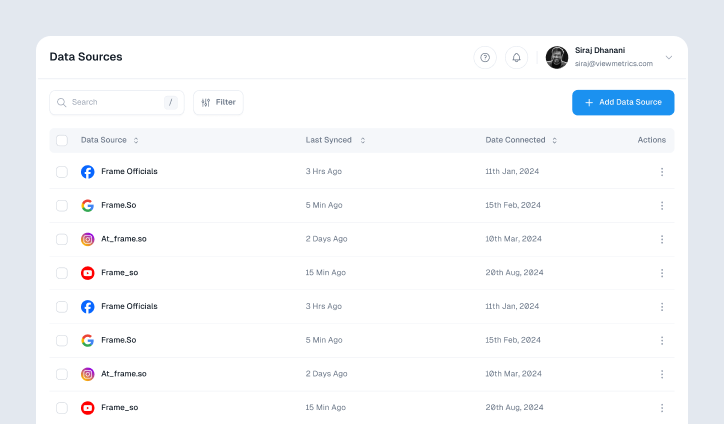
- Once you’re in the dashboard, go to the data source section.
- Click on “Connect Data Source” and pick LinkedIn from the list.
- You’ll be asked to log in and give permission to link your LinkedIn business page.
- Make sure you have admin access to the page you want to track.
Step 3: Link Your Google Drive
- To keep things organized, connect your Google Drive to ViewMetrics.
- This way, every report gets saved directly to your Drive without you having to do anything manually.
- It’s also helpful for team access and backup.
Step 4: Set Up Automated Reporting
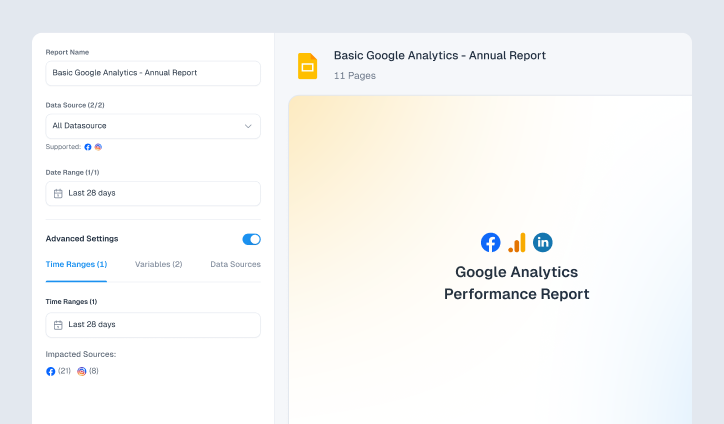
- Head to the “Reports” section and click on “Create New Report.”
- Choose the LinkedIn Report Template and select your connected LinkedIn page.
- You can set the time period for the report starting from weekly, monthly, or a custom range.
Here are some of the metrics ViewMetrics will track for you:
- Follower Growth Rate
- Post Engagement (likes, comments, shares, clicks)
- Lead Conversion Rates
- Follower Demographics and Audience Breakdown
Step 5: Pick the Format for Your Reports
ViewMetrics gives you flexibility when it comes to how you want your reports:
- PDF format for clean, professional sharing
- Excel sheets if you want to do deeper analysis
- Google Slides for ready-to-use presentations
- Interactive dashboards if you want live, on-the-go insights
Step 6: Generate and Review Your Reports
- After you’re done setting everything up, click “Create Report.”
- In just a few minutes, ViewMetrics will pull all your LinkedIn data and turn it into a neat report.
- It also uses AI to spot patterns and highlight useful trends you might have missed.
Some of the advanced features include:
- Real-time updates so you don’t miss anything
- Report templates you can tweak to suit your goals
- Automated scheduling for reports to be sent out regularly
- Competitive benchmarks to compare your growth with others in your space
Step 7: Access and Share the Results
- Once the report is ready, you can download it directly from the dashboard.
- You’ll also find a copy automatically saved in your Google Drive.
- Sharing is easy. Just copy the secure link or set up automated sharing with your team or clients.
Step 8: Explore Advanced Analytics
With ViewMetrics, we suggest you take full advantage of the advanced analytics features available in your dashboard. These go far beyond the basics and help you understand what’s really driving your LinkedIn performance.
Some of the tools worth exploring include:
- Audience Insights that show detailed follower demographics and behavior patterns
- Engagement Overview that breaks down reactions, comments, and shares
- Content Performance tracking to spot your top-performing posts
- Historical Data that lets you review long-term trends over different timeframes
You’ll also get access to AI-driven features like:
- Pattern recognition to understand how your audience is growing
- Content suggestions based on what has worked well before
- Predictive analytics that help you plan ahead
- Alerts that notify you when there are sudden shifts in your metrics
By diving into these features, you can move from basic reporting to real insight-led strategy.
Best Practices for Boosting LinkedIn Follower Growth
Tracking is helpful, but what you do daily matters more when it comes to growing your LinkedIn followers. Here are a few practical things you can start with:
- Post regularly and share content that actually helps or teaches something.
- Reply to comments and messages to keep the conversation going.
- Try using polls, videos, and carousels to make your posts more engaging.
- Team up with other LinkedIn creators or brands to reach new people.
- Add your LinkedIn page link in your email signature, website, or other social media platforms.
Closing Thoughts
Tracking your LinkedIn follower growth helps you understand what’s working and what needs a tweak. It’s about learning what connects with people and adjusting as you go. Whether you use LinkedIn’s tools or a platform like ViewMetrics, the insights can guide you in the right direction. Focus on what your audience connects with, post with purpose, and give it time. Growth doesn’t happen overnight, but with a little patience and consistency, you’ll start to see the difference.
Frequently Asked Questions (FAQs)
Can I track follower growth for my personal LinkedIn profile?
Yes, you can. If you’ve turned on creator mode, LinkedIn gives you access to basic follower insights. It’s not as detailed as company page analytics, but it’s still useful.
How often should I check my follower growth?
Weekly or monthly works best. Daily changes are usually small and don’t show meaningful trends.
Can I see who exactly followed me?
LinkedIn gives you limited information. Most of what you’ll see is in totals or general trends, not full lists of names.
Are third-party tools like ViewMetrics safe to use?
Yes, trusted tools like ViewMetrics follow LinkedIn’s API rules. They only access your data in a secure, read-only way.
Does follower count directly impact my LinkedIn reach?
Not directly. But the more engaged followers you have, the better chance your posts have of being seen and shared.
What is the difference between a LinkedIn “follower” and a “connection”?
Connections are mutual. Both people have agreed to connect. Followers are one-way. They see your public posts, but you’re not connected unless you follow them back.
Can I track my competitors’ follower growth?
Yes. If you manage a company page, there’s a “Competitors” section in the analytics. You can add up to nine pages to compare metrics like follower growth and engagement.
What is a good follower growth rate on LinkedIn?
There’s no fixed number. It depends on your industry and profile size. What matters more is that your followers are growing steadily over time.

