
If you have ever had all the data in front of you and still were not sure what to do next, you are not alone. Businesses today have more information than ever, and more ways to report on it. But having data is only half the equation. The other half is knowing how to structure it so it points clearly to decisions.
A strategic dashboard is how you complete that equation. It brings your reporting together in one focused view, so the right people always know what is happening, what it means, and what to do about it.
By the end of this blog, you will know exactly what a strategic dashboard is, what it should include, and how to use it alongside your reporting to keep your entire team aligned with your long-term goals.
What Is a Strategic Dashboard?
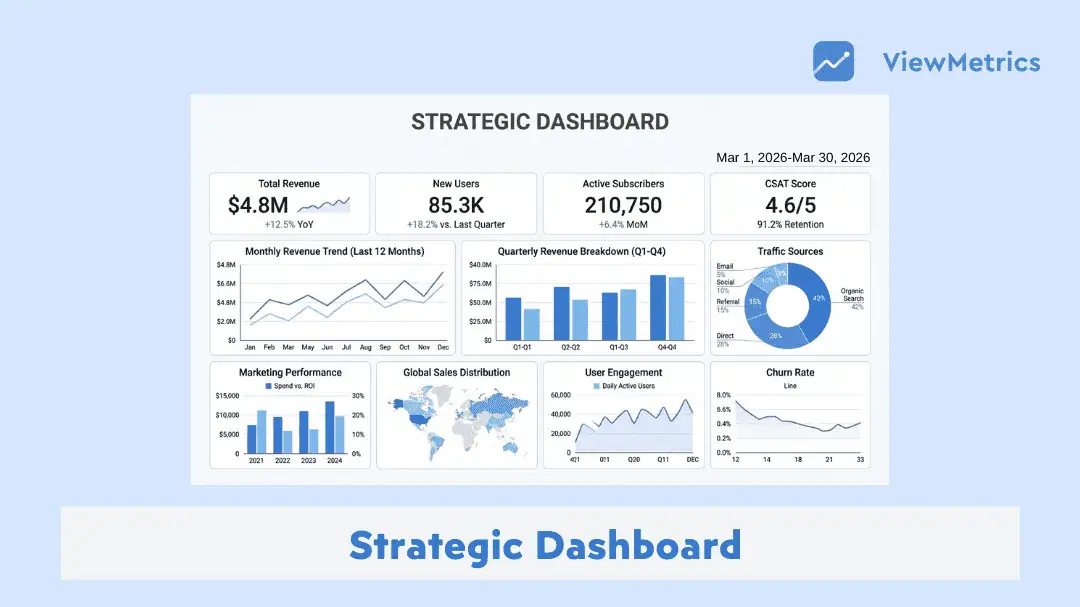
A strategic dashboard is a tool that gives you a clear, high-level view of how your business is performing over time. It brings together important metrics in one place so leadership teams can understand whether they are moving in the right direction.
Instead of focusing on day-to-day tasks, a strategic dashboard looks at the bigger picture. It shows how close the business is to its long-term goals using key performance indicators such as revenue growth, customer retention, or return on investment.
Most strategic dashboards are designed to be simple and easy to scan. You should be able to open it and quickly understand what is improving, what is slowing down, and where attention is needed. This helps decision-makers act faster without going through multiple reports or spreadsheets.
In simple terms, if you want to track long-term progress and make informed decisions without getting lost in details, a strategic dashboard helps you do that.
Related Read – 4 Types of Dashboard
Key Components of Strategic Dashboards
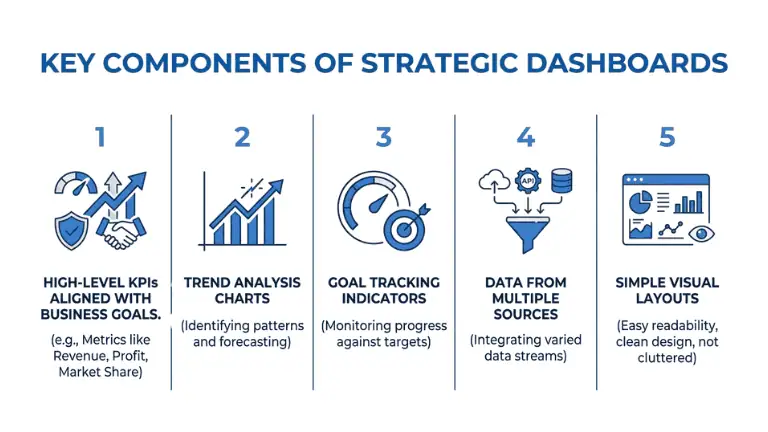
A strategic dashboard works best when it keeps things focused and easy to read. Here are the main components you will usually find:
-
High-Level KPIs Aligned With Business Goals
These are the core metrics that reflect your overall performance. They could include revenue growth, customer retention, profit margins, or market share. Each KPI should directly connect to a business objective.
-
Trend Analysis Charts
Instead of showing only current numbers, strategic dashboards highlight trends over time. This helps teams understand whether performance is improving, declining, or staying consistent.
-
Goal Tracking Indicators
These show how actual performance compares with targets. It could be in the form of progress bars, percentage completion, or visual markers that indicate whether goals are being met.
-
Data From Multiple Sources
Strategic dashboards usually pull data from different tools such as CRM systems, financial software, and analytics platforms. This creates a unified view without switching between systems.
-
Simple Visual Layouts
You don’t need complicated visuals here. Simple charts and KPI cards usually do the job. The whole point is that someone should be able to open the dashboard and understand what’s going on in a few seconds, without going through raw data.
Strategic Dashboard Examples
To understand how these dashboards work in real settings, let’s look at a couple of common examples.
-
Executive Performance Dashboard
In most companies, leadership teams need a broad view of business health. An executive dashboard brings everything important into one place.
It brings together performance from different areas of the business so leaders can quickly understand how things are moving as a whole.
If the dashboard shows slowing growth or falling profits, it signals that something needs attention. Leadership can then review strategies, adjust budgets, or shift focus to stronger areas.
-
Marketing Strategy Dashboard
Marketing teams often look at long-term performance rather than daily campaign results. A strategic marketing dashboard helps track how brand and growth efforts are evolving over time.
This dashboard may include metrics like lead generation trends, customer acquisition, campaign returns, and overall traffic growth.
If the data shows that leads are not converting well or growth has slowed, the team can refine targeting, update messaging, or shift spending to better-performing channels.
How to Create a Strategic Dashboard?
Building a strategic dashboard does not need to be complicated, but it does require clarity. Here is a simple way to approach it.
-
Define the Audience
Start by identifying who will use the dashboard. In most cases, this will be executives or leadership teams. Knowing the audience helps you decide what level of detail is needed.
-
Select the Right KPIs
Choose metrics that reflect overall performance, not daily activity. Focus on numbers that connect directly to business goals such as revenue targets, ROI, customer retention, or NPS.
-
Connect Reliable Data Sources
Make sure the data comes from trusted systems. This could include CRM tools, financial platforms, analytics software, or even structured spreadsheets. Accuracy matters more than volume.
-
Design a Clear Layout
Place the most important metrics at the top. Use charts and visual indicators that are easy to understand at a glance. Avoid overcrowding the dashboard with too many elements.
-
Review and Update Regularly
A dashboard should evolve with the business. Take feedback from users, refine what is shown, and ensure the data stays updated. Outdated dashboards quickly lose value.
How ViewMetrics Helps Create Strategic Dashboards?
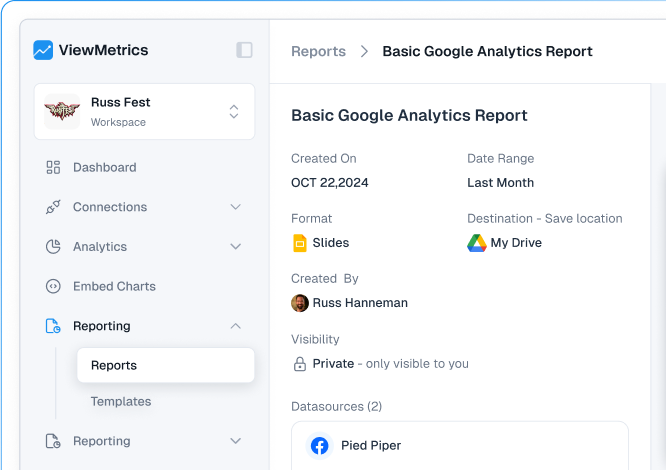
Tools like ViewMetrics are designed to simplify the process of building and managing strategic dashboards. Instead of manually pulling data from different tools, everything can be brought together in one place.
Here is how it helps.
-
Combines Data Across Platforms
You can connect multiple data sources and view everything in a single dashboard without switching between tools.
-
Tracks Long-Term Performance
It focuses on high-level metrics, making it easier to monitor progress over time instead of getting lost in daily numbers.
-
Real-Time Updates
Data refreshes automatically, so decisions are based on current information rather than outdated reports.
-
Easy Export Options
Dashboards can be exported to tools like Google Sheets or Slides, which helps during presentations or reporting.
-
Simplifies Reporting for Teams
Both leadership and team members can understand performance without needing technical expertise.

Closing Thoughts
A strategic dashboard helps you step back and look at your business from a wider lens. Instead of getting lost in daily numbers, you focus on where the business is heading over time.
When built correctly, it becomes a reliable guide for decision-making. You can spot trends early, track progress toward goals, and make adjustments with confidence.
If your goal is to stay aligned with long-term growth rather than short-term noise, a strategic dashboard is worth setting up.
Frequently Asked Questions (FAQs)
-
What is the difference between strategic and operational dashboards?
Strategic dashboards focus on long-term goals and overall business performance. Operational dashboards deal with day-to-day activities and short-term metrics.
-
What should a strategic dashboard include?
It should include high-level KPIs, trend data, goal tracking indicators, and information pulled from multiple reliable sources.
-
Who uses strategic dashboards in an organization?
They are mainly used by executives, leadership teams, and decision-makers who plan and review long-term strategies.
-
What KPIs are commonly used in strategic dashboards?
Common examples include revenue growth, profit margins, customer retention, ROI, and market share.
-
Can small businesses use strategic dashboards?
Yes, even small businesses can benefit from them. In fact, having a clear view of performance can help smaller teams make better decisions with limited resources.


