Running Facebook Ads without tracking the right numbers is like flying blind. If you’re spending money on ads, you need to know what’s working and what’s not. That’s where KPIs come in. In this blog, we’ll walk through 17 Facebook Ads KPIs you should track to understand performance, make better decisions, and get the most out of your budget. Whether you’re new to ads or managing multiple campaigns, these metrics will help you stay on track.
What Are Facebook Ads KPIs?
Facebook Ads KPIs (Key Performance Indicators) are specific, measurable metrics that help you track how well your ad campaigns are performing against your marketing goals. These include numbers like reach, impressions, click-through rate (CTR), cost per click (CPC), conversion rate, and return on ad spend (ROAS). If you’re running Facebook ads, these KPIs show whether people are engaging with your content, taking action, or just scrolling past. By checking these metrics regularly, you can adjust your budget, creative, or audience targeting to improve performance and stop wasting money on ads that don’t convert.
Why Tracking the Right Facebook Ads KPIs Is Critical
Here’s why keeping an eye on the right KPIs matters:
-
Ensures Ad Spend Is Tied to Real Business Outcomes
It’s easy to get clicks and impressions, but those numbers mean nothing if they don’t lead to real results. Tracking KPIs like purchases, sign-ups, or leads ensures that your money is going toward actions that actually support your business goals. When you focus on outcome-based metrics, you can clearly see what’s working.
-
Improves Budget Allocation Across Campaigns and Audiences
Not all ads and audiences perform the same. Some bring better results at a lower cost. By tracking your KPIs, you can spot these differences and shift your budget where it matters most. Instead of guessing, you use data to back your decisions and make sure you’re not wasting money on underperforming segments.
-
Helps Identify What to Scale and What to Pause Quickly
Once your ads are live, you need quick feedback. The right KPIs show you fast what’s working and what’s not. If a campaign is converting well, scale it up. If another is draining money without results, pause it. Good tracking lets you act fast, not weeks later when the budget’s gone.
-
Prevents Optimization Around Vanity or Misleading Metrics
Not all high numbers are good news. A post with lots of likes or a campaign with thousands of impressions can look great on the surface but may not lead to sales. When you track KPIs that reflect actual performance, you avoid getting distracted by numbers that look nice but do nothing for your business.
-
Enables Data-Driven Decisions for Continuous Performance Improvement
With the right KPIs in place, every decision is backed by data, not guesswork. You can test creatives, try new audiences, or explore different placements knowing you’ll have solid numbers to measure success. Over time, this habit of tracking and tweaking leads to better results and a stronger ad strategy.
17 Best Facebook Ads KPIs to Track
-
Return on Ad Spend (ROAS)
Return on Ad Spend tells you how much revenue you’re making for every dollar you spend on Facebook Ads. It’s one of the most important metrics if you’re selling products or running an e-commerce business. This number shows you right away whether your ads are actually profitable. A ROAS of 3:1 means you’re earning three dollars for every one you spend, which is often the minimum goal for healthy growth. The higher this number, the more confident you can be about increasing your ad budget.
How to calculate it:
- Basic ROAS = Total Revenue ÷ Total Ad Spend
Example:
You spend $1,000 on ads and make $5,000 from those campaigns. Your ROAS is 5:1 or 500%.
-
Ad Revenue (Average Revenue Per User / ARPU)
Ad Revenue or ARPU gives you a bigger picture of how much money each user brings in after engaging with your Facebook ad. This is especially useful for apps and subscriptions where users keep interacting over time. It helps you understand whether you’re attracting users who will keep bringing value, not just one-time conversions. Tracking this over different timeframes like 1-day, 7-day, or 30-day helps you see how user value grows.
How to calculate it:
- Total Ad Revenue = Sum of all revenue from ad-attributed users
- ARPU = Revenue from Install Cohort ÷ Number of Users in Cohort
Example:
If you earn $500 from 200 app installs, your ARPU is $2.50.
-
Cost Per Result (CPR)
Cost Per Result shows how much you are paying, on average, to achieve any one goal in your campaign. It is a flexible metric because the “result” can be anything you choose, such as a video view, a lead, an add-to-cart, or a purchase. CPR helps you compare campaigns side by side and judge how efficiently your budget is turning into actual outcomes, no matter what that outcome is. It is a good metric when you are testing different creatives or objectives because it shows how much each result is costing you, regardless of the type.
How it is calculated:
- CPR = Total Ad Spend ÷ Total Number of Results
Example:
Spend $400 and get 100 results (could be any defined action). Your CPR is $4.
-
Cost Per Action (CPA)
Cost Per Action is a more specific version of CPR. While CPR can mean any result, CPA focuses only on conversion-related actions such as a sale, a lead form filled out, a download, or a sign-up. It is especially important for campaigns where each action has a direct business value. CPA helps you control your ad bidding and budgeting by setting how much you are willing to pay for each meaningful action. It is often used in lead generation, e-commerce, and performance-focused campaigns.
How it is calculated:
- CPA = Total Campaign Cost ÷ Number of Actions Taken (like purchases or sign-ups)
Example:
Spend $1,000 and get 50 conversions. Your CPA is $20.
-
Cost Per Lead (CPL)
Cost Per Lead shows how much it costs you to get one new lead from Facebook Ads. This is a crucial metric if you’re in B2B, education, finance, real estate, or any service-based business. Leads are the starting point of your sales funnel, and tracking CPL helps you estimate how far your budget will take you. A lower CPL means you’re acquiring potential customers more affordably.
How to calculate it:
- CPL = Total Ad Spend ÷ Number of Leads
Example:
Spend $500 and collect 50 leads. Your CPL is $10.
-
Conversion Rate
Conversion Rate shows the percentage of people who clicked your ad and actually took the next step you wanted them to take. This could be buying a product, signing up for a service, or downloading something. A strong conversion rate tells you that your landing page is doing its job well. It also reflects how clear and convincing your ad offer is.
How to calculate it:
- Conversion Rate = (Total Conversions ÷ Total Clicks) × 100
Example:
You get 100 conversions from 2,000 clicks. Your conversion rate is 5%.
-
Spend
Spend refers to how much you’ve actually spent on your Facebook ad campaigns. It’s the first number you need to watch before evaluating anything else. This tells you if you’re staying on budget, overspending, or underusing your daily limits. Tracking this regularly helps you understand whether your budget is being used well or if it needs reallocation.
How to calculate it:
- Total Spend = Sum of all ad spend during the campaign period
- Daily Spend = Amount spent per day
- Campaign Spend = Combined spend from all ad sets in the campaign
-
Cost Per Click (CPC)
Cost Per Click is how much you’re paying every time someone clicks on your ad. It’s one of the most watched Facebook KPIs because it helps you figure out how expensive your traffic is. A high CPC might mean your ad isn’t connecting with the right audience or your messaging needs improvement. Lowering CPC while keeping engagement high is one way to stretch your ad budget further.
How to calculate it:
- CPC = Total Ad Spend ÷ Total Link Clicks
Example:
You spend $100 and get 50 link clicks. That gives you a CPC of $2.00.
Tip:
CPC is influenced by your CTR and CPM. If you improve your click-through rate, your CPC usually goes down.
-
Click-Through Rate (CTR)
Click-Through Rate shows how many people saw your ad and then clicked on it. It’s one of the most direct ways to measure how engaging or relevant your ad is. A good high CTR means your ad is grabbing attention and getting people to act. A low CTR might signal that your creative or targeting needs work. Meta’s ad system often rewards high-CTR ads with lower costs and better placements. While the average CTR is around 0.89 to 0.90 percent, strong ads can go above 1.5 percent or even higher.
How to calculate it:
- CTR = (Total Link Clicks ÷ Total Impressions) × 100
Example:
If you get 100 clicks from 10,000 impressions, your CTR is 1 percent.
-
Engagement Rate
Engagement Rate tells you how many people interacted with your ad compared to how many saw it. This includes likes, comments, shares, and reactions. It gives you insight into how appealing and relatable your content is, even if those interactions don’t lead directly to clicks or sales. Higher engagement often leads to more reach, since Facebook’s algorithm tends to promote content that people interact with. This metric is especially helpful when you’re testing creative ideas or running brand awareness campaigns.
How to calculate it:
- Engagement Rate = (Total Engagements ÷ Total Impressions) × 100
- Alternative Formula = (Likes + Comments + Shares + Reactions) ÷ Page Fans × 100
Example:
If you get 1,000 engagements from 50,000 impressions, your engagement rate is 2 percent.
-
Post Engagements (Likes, Comments, Shares)
Post Engagements measure how often people react to your ad through likes, comments, shares, and reactions. These interactions help you understand how your audience feels about your content. Shares usually show strong support, comments suggest discussion, and likes show general approval. Even though these are sometimes called vanity metrics, they still play a role in boosting organic visibility and judging creative performance.
How to calculate it:
- Total Post Engagements = Likes + Comments + Shares + Reactions
- Engagement per Impression = Total Engagements ÷ Impressions
-
Link Clicks
Link Clicks show how many times users clicked a link in your ad that takes them to a landing page, website, or any other destination. This metric is key when your goal is to drive traffic. It focuses only on actual link clicks, not on other ad interactions like likes or comments. If you see high link clicks but low conversions, that’s usually a sign to improve your landing page or offer.
How to calculate it:
- Link Clicks = Total number of clicks on destination links
- CTR (Link Clicks) = (Link Clicks ÷ Impressions) × 100
- CPC (Link Clicks) = Ad Spend ÷ Link Clicks
-
CPM (Cost Per 1,000 Impressions)
CPM tells you how much you’re paying to get your ad shown 1,000 times. It’s useful for understanding how much it costs to simply get seen. Lower CPM means you’re reaching people more affordably. If you see high CPMs, it could be due to targeting a narrow or highly competitive audience, or using underperforming creative. The global average for CPM on Facebook Ads is about $8.77, but this can vary widely depending on your industry and campaign type.
How to calculate it:
- CPM = (Total Ad Spend ÷ Impressions) × 1,000
Example:
If you spend $100 and get 10,000 impressions, your CPM is $10.
-
Reach
Reach measures the number of unique people who saw your ad. It helps you understand how far your campaign has spread and how much of your audience you’re actually reaching. This is especially useful for brand awareness campaigns or when testing the top of your funnel. Reach also helps you track how much your ads are expanding beyond your usual audience. If your reach is high but impressions are much higher, it means some people are seeing your ad multiple times.
How to calculate it:
- Reach = Number of unique users who saw the ad
Example:
If your reach is 100, that means 100 unique users saw your ad
-
Impressions
Impressions tell you how many times your ad was displayed on a screen. Unlike reach, this number counts multiple views by the same person. Impressions are the base for measuring things like CTR, engagement rate, and CPM. If your impressions are high but clicks are low, it’s usually a sign to revisit your creative or targeting. If impressions stay flat, it might mean your budget is too low or your audience is too small.
How to calculate it:
- Impressions = Total number of times the ad was shown
- Relationship = Reach × Frequency = Impressions
Example:
If 100 people each see your ad 3 times, that’s 300 impressions.
-
Frequency
Frequency tells you how often each person in your audience is seeing your ad. While some repetition is helpful for brand recall, too much can lead to ad fatigue. When frequency goes beyond 3, you should start monitoring audience reactions and performance metrics closely. High frequency with dropping conversions usually means it’s time to refresh your ad creative or expand your audience.
How to calculate it:
- Frequency = Total Impressions ÷ Reach
Example:
If your ad had 200 impressions and a reach of 100, your frequency is 2.0. That means, on average, each person saw your ad twice.
-
Share of Voice (SOV)
Share of Voice shows how much visibility your brand is getting compared to your competitors. It helps you understand whether you’re being seen as often as others in your market. Higher SOV usually means higher brand awareness and, over time, a bigger market share. On Facebook, this is often represented by impression share. It tells you what portion of the total available impressions you’re capturing in your niche.
How to calculate it:
- Share of Voice = (Your Brand’s Metric ÷ Total Market Metric) × 100
- Impression Share = Your Impressions ÷ Total Available Impressions × 100
Example:
If your ad received 700 impressions and there were 1,000 total available, your impression share is 70 percent.
How to Choose the Right Facebook Ads KPI
Picking the right KPI for your Facebook ads starts with knowing exactly what you want to achieve. Here’s how to go about it:
-
Define Your Business Goal
Start with the big picture. Are you looking for more sales, leads, app installs, or just building brand awareness? Be clear about what success looks like before diving into numbers.
-
Align with Your Facebook Ad Objective
Facebook gives you different campaign objectives like Reach, Engagement, Conversions, and Lead Generation. Make sure your KPI fits the objective you’ve selected. For example, don’t track purchases if your campaign is set for awareness.
-
Select the Right Metrics
Once you’ve got the goal and objective sorted, pick the metrics that will actually show progress.
- For traffic: Click-Through Rate (CTR), Cost Per Click (CPC)
- For conversions: Cost Per Conversion, Conversion Rate
- For brand awareness: Reach, Impressions, Ad Recall
Avoid tracking everything at once. Focus on what matters.
-
Set Realistic Targets
Don’t expect overnight success. Set baseline numbers and try to improve them gradually. Look at industry benchmarks if you’re unsure where to start.
-
Test and Optimize
No campaign gets it right from the start. Track your KPIs, compare them across audiences and creatives, and refine things as you go. Treat every campaign as a learning opportunity.
Common Facebook Ads KPI Mistakes to Avoid
Even with the right KPIs, mistakes happen. Watch out for these common ones that can throw your performance off track:
-
Focusing on Vanity Metrics
Clicks and impressions feel good, but if they’re not tied to sales or leads, they don’t help. Always focus on KPIs that lead to revenue or conversions.
-
Ignoring Conversion Lag
Some ads don’t convert immediately. If you judge performance too soon, you might stop a good campaign early. Always consider the delay between someone seeing your ad and taking action.
-
Optimizing for the Wrong Stage
Each funnel stage needs different KPIs. Awareness ads shouldn’t be judged on purchases. Likewise, retargeting ads should do more than just get clicks.
-
Overlooking Frequency and Fatigue
If the same ad shows up too often, people stop engaging. Keep an eye on frequency and swap out creative if performance drops.
-
Not Segmenting by Audience or Placement
Your ads perform differently across age groups, devices, or placements like Stories vs. Feed. Segment your KPIs to get a clearer picture and optimize properly.
Top Tools to Measure Facebook Ads KPIs
Here are three reliable Facebook Ads reporting tools you can use to track and analyze your KPIs with confidence:
-
Meta Ads Manager
This is your main dashboard for tracking Facebook Ads. It gives you access to every metric, lets you build custom reports, and helps you monitor results in real time.
-
Google Analytics (GA4)
Use GA4 to track what users do after they click on your ad. You can set up conversion events, see bounce rates, and understand how Facebook traffic performs compared to other channels.
-
ViewMetrics
Ideal for pulling reports, comparing campaigns, and sharing results with clients or team members. It simplifies reporting without losing the details.
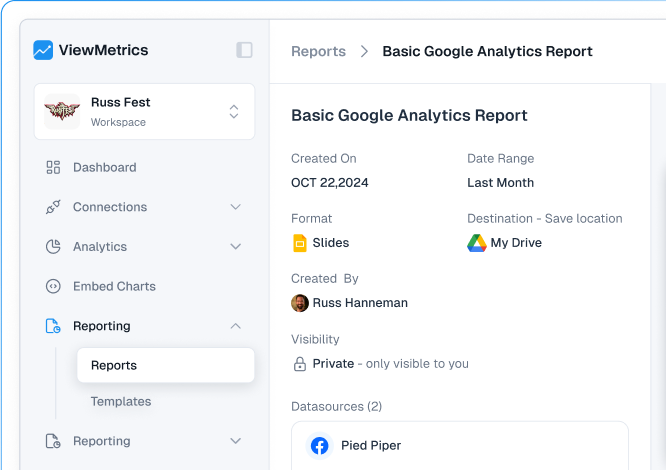
How ViewMetrics Helps You Track Facebook Ads KPIs
If you’re running Facebook Ads, you probably spend a lot of time jumping between tabs, checking metrics, and exporting spreadsheets. ViewMetrics makes this part easier by bringing all your campaign data into one clean dashboard with facebook ads integration. You can track your most important Facebook Ads KPIs without wasting time or digging through Ads Manager.
With ViewMetrics, your impressions, clicks, conversions, and ad spend from Meta Ads are pulled in automatically. You get clear visuals, ready-to-use facebook ads templates, and filters to look at results by campaign, ad set, audience, creative, or date. This means you can instantly spot what’s working and what’s costing you money.
Here’s how it supports your Facebook Ads KPI tracking:
- All Accounts in One Place: You can connect multiple Facebook and Instagram ad accounts and see everything in one view. Reach, clicks, conversions, and revenue are all tracked together.
- Pre-made Templates: Skip the setup. You get ready-to-use Facebook Ads overview templates so you don’t need to build your own reports from scratch.
- Custom Filters for Your Funnel: Whether you care about ROAS, CPL, CPA, or CTR, you can choose the exact KPIs that matter and compare them over time.
- Scheduled Reports Made Simple: Want to send weekly or monthly updates to clients or your team? You can set up automatic report scheduling and export them as PDFs or slides. No more manual work.
This kind of setup helps you focus on performance instead of wasting time on spreadsheets. Whether you’re managing one account or ten, ViewMetrics gives you a faster, smarter way to stay on top of Facebook Ads KPIs.

Closing Thoughts
Tracking Facebook Ads KPIs is not about watching numbers for the sake of it. It is about understanding what is helping your business grow and where your money is actually working. When you focus on the right metrics, you make smarter budget decisions, improve your ads faster, and avoid wasting spend on campaigns that do not deliver results. Start with a few important KPIs, review them regularly, and keep testing and improving. Over time, this simple habit can make a big difference in how well your Facebook Ads perform.
Frequently Asked Questions (FAQs)
-
How often should you review Facebook Ads KPIs?
Check your KPIs weekly. If you’re running a fast-paced or high-budget campaign, daily checks help catch issues early.
-
What are the most important Facebook Ads KPIs for eCommerce businesses?
The most important Facebook Ads KPIs for eCommerce businesses are Return on Ad Spend (ROAS), Cost per Purchase, Conversion Rate, Average Order Value.These show how well your ads are turning clicks into actual sales.
-
Which Facebook Ads KPIs matter most for lead generation campaigns?
For lead generation campaigns in Facebook Ads track:Cost per Lead, Conversion Rate, Click-Through Rate and Lead Quality. These help measure both how many leads you’re getting and how useful they are.
-
What is a good ROAS for Facebook Ads?
A ROAS of 3:1 is generally considered good. It means you’re earning $3 for every $1 spent on ads.
-
How do you choose the right KPI for a Facebook Ads campaign objective?
Choose a KPI that directly shows whether your goal is being met. Start with your campaign goal: for sales: focus on ROAS, for leads: track cost per lead, for awareness: look at reach and impressions.
-
Can Facebook Ads KPIs vary by industry?
Yes. KPIs like cost per click or ROAS can look very different for eCommerce, SaaS, real estate, or education. Use industry benchmarks to compare your performance.
-
What’s the difference between Facebook Ads metrics and KPIs?
Metrics are all the data points Facebook shows you. KPIs are the few that actually matter for measuring success based on your specific goal.
-
Should you track Facebook Ads KPIs daily or weekly?
If you’re spending a lot or running short-term ads, track daily. For longer campaigns with smaller budgets, weekly tracking works fine.