As the year wraps up, it’s the perfect time to look back at how your marketing efforts performed. A year-end marketing report helps you bring everything together in one place, including your wins, challenges, and lessons. It’s not just about numbers; it’s about understanding what worked, what didn’t, and how to plan smarter for the next year. Whether you manage your brand or handle marketing for clients, this guide will help you create a clear, simple report that not only highlights your performance but also helps you plan smarter for the next year. Let’s get started.
What Is an End-of-the-Year Marketing Report?
An end-of-the-year marketing report is your team’s full recap of how the marketing efforts went over the past twelve months. It pulls together data on what worked, what fell short, and how your results matched up with your goals. You’ll usually find campaign results, key metrics, and trends that shaped the year. This kind of report helps you plan smarter for the future, justify your next budget, and show the return on investment from your efforts. It’s a solid way to wrap up the year with clear insights and a fresh direction.
Read related: Marketing Reports
What To Include in an End-of-the-Year Marketing Report?

An end-of-the-year marketing report helps you look back, analyse results, and plan what comes next. Here’s what you should include to make it complete and useful:
-
Executive Summary
Start with a short overview of the year. Summarize your biggest achievements, overall performance, and how your results matched your goals. This helps your readers quickly understand the year’s story without diving into all the numbers right away.
-
Key Learnings and Annual Highlights
Reflect on the main takeaways from your campaigns. What lessons did you learn? What worked surprisingly well, and what fell short? Highlight major milestones, successful launches, or creative experiments that made a difference.
-
Attribution
Explain where your results came from. Which channels brought in the most conversions? How did users find you? Whether it was paid ads, email marketing, social media, or organic traffic, break down the customer journey. This helps your team see what really influenced your outcomes.
-
Marketing Channels and KPIs
List each marketing channel you used, such as social media, paid ads, email, SEO, and others. Share how each one performed. Support this with key numbers like impressions, clicks, conversions, or engagement rates. Use visuals if possible. This is where you get specific and back up your story with data.
-
Audience Data
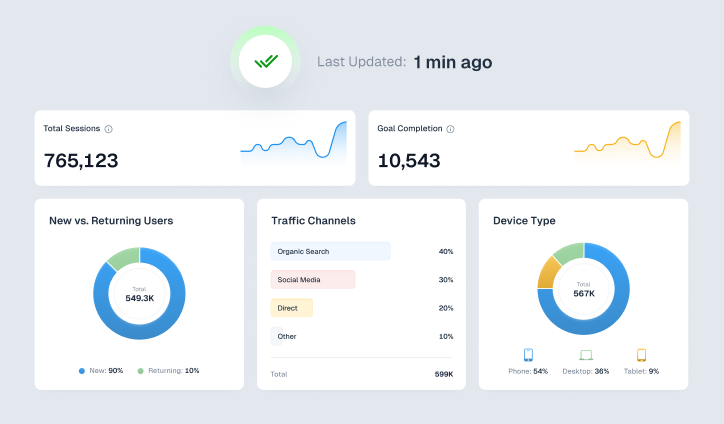
Show who you reached this year. Include insights about demographics, user behaviour, location, devices, and any trends you noticed in your audience. The better you understand your audience, the easier it becomes to shape smarter campaigns next year.
-
Year-over-Year Performance
Compare this year’s performance to last year’s. Look at growth, dips, and patterns across the board. Did web traffic go up? Did conversions improve? Were there any surprises in campaign outcomes? This section is great for spotting long-term progress and areas that still need attention.
-
Marketing Goals and Strategy for the Next Year
End your report by setting the tone for what’s ahead. Based on your results and learnings, lay out the goals for next year. These could include improving engagement, trying new channels, or strengthening brand awareness. Also, share how you plan to get there, what you will continue doing, what needs to change, and what new strategies you want to test.
How To Create a Yearly Marketing Report?
Here’s how you can create a yearly marketing report:
Step 1: Gather Data for Your End-of-Year Marketing Report
Start by collecting data from every marketing channel you’ve used throughout the year. This includes website analytics, social media stats, ad campaign reports, email marketing metrics, SEO tools, and sales performance data. Make sure nothing gets left out. The more complete your data, the more useful your report will be.
Step 2: Analyze the Data
Once the data is in one place, it’s time to dig in. See how each channel performed over the months. Look at trends in traffic, conversions, engagement, and return on investment. Try to connect the dots between what you did and how your audience responded. This step gives you a full picture of what actually happened throughout the year.
Step 3: Identify Your Biggest Marketing Wins
Now it’s time to highlight what went well. Which campaigns brought the most traffic? Which posts went viral? What generated the most leads or sales? Pointing out your top-performing strategies helps you understand your strengths, so you can build on them next year. It also gives your team or clients something to celebrate.
Step 4: Analyze Areas for Improvement
No strategy is perfect. Take an honest look at the parts that didn’t go as planned. Maybe a campaign flopped or a new channel didn’t bring the returns you hoped for. Instead of just pointing out what failed, try to understand why it happened. This helps you avoid repeating mistakes and shows you’re learning from the experience.
Step 5: Review the Competitive Landscape
Take a moment to check what your competitors have been up to. Did they try something new? Launch a bold campaign? Gain a stronger online presence? Knowing where you stand in the market helps you spot opportunities and threats, and it gives context to your own results.
Step 6: Review Customer Insights and Feedback
Your audience’s voice is just as important as your numbers. Look at survey results, social media comments, reviews, and customer support feedback. What did your customers love? What did they complain about? These insights can guide your future content, messaging, and campaign focus.
Step 7: Next Year’s Plan
Now that you’ve reviewed the past, it’s time to plan ahead. Use everything you’ve learned to outline your goals, key projects, and channel priorities for next year. Be realistic, set clear metrics, and note what you want to test or experiment with. A strong report ends with a forward-looking plan that’s rooted in real data.
How to Set Up End-of-the-Year Marketing Reporting in ViewMetrics
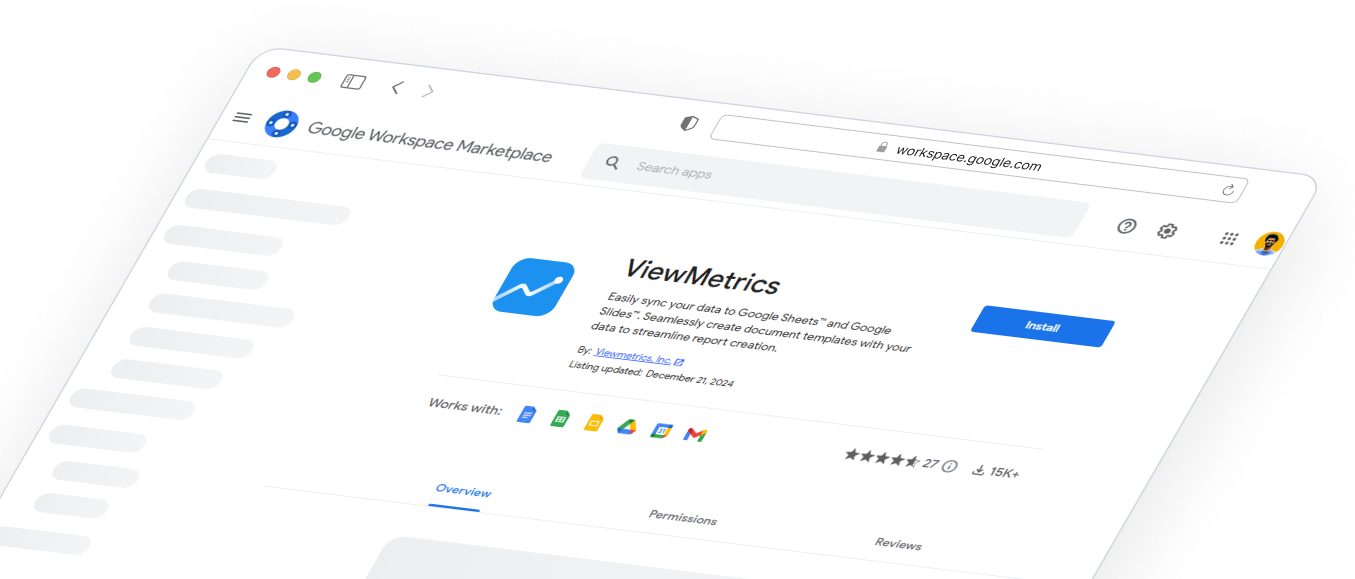
Setting up your end-of-the-year marketing report in ViewMetrics is simple and doesn’t take long. Here’s how you can do it:
Step 1: Create or Log In to Your Account
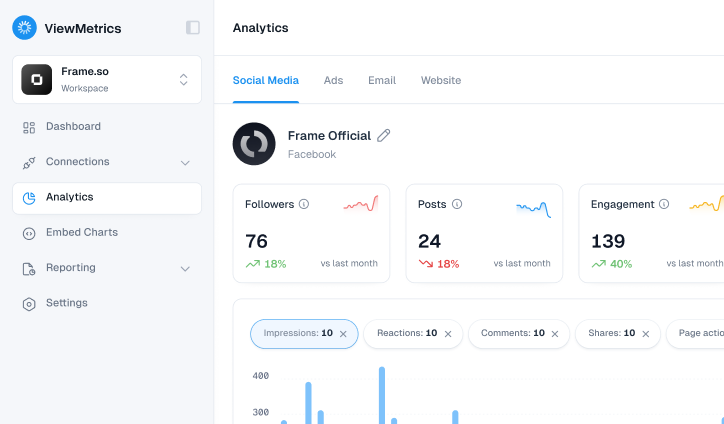
Start by visiting the ViewMetrics website and logging in to your account. If you’re new, create one by signing up with your email. Once you’re in, you’ll be taken to your dashboard, where you can manage all your marketing data and reports.
Step 2: Connect Your Data Sources
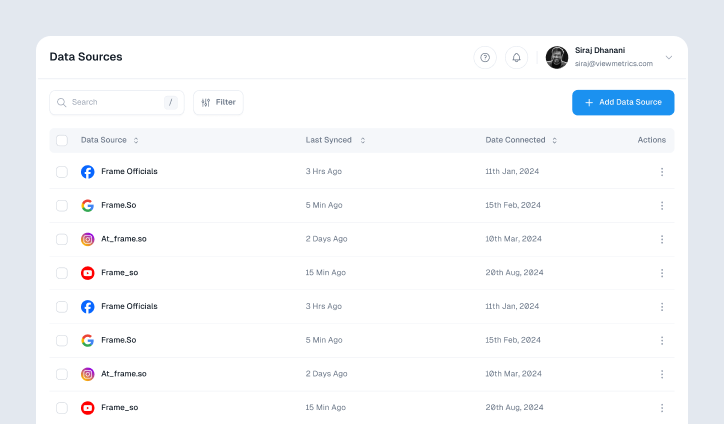
Next, link the platforms you want to pull data from. This could include Google Analytics, Facebook Ads, LinkedIn, or any other marketing tools you use. ViewMetrics will automatically sync the data, saving you from manual downloads and spreadsheets.
Step 3: Choose a Pre-Designed Report Template
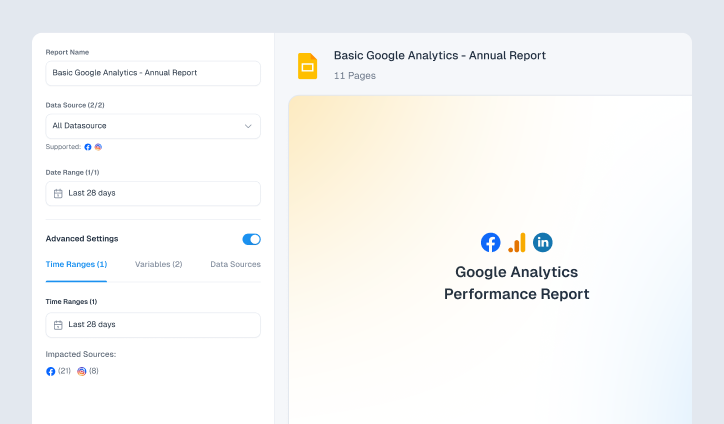
ViewMetrics offers pre-designed templates to make your work easier. Select the one that fits your reporting needs. These templates are built to highlight important metrics and give your report a clean, professional layout.
Step 4: Choose the Report Format and Create the Report
Choose the format you want your report in. Whether it’s a presentation-style PDF or a spreadsheet for your team, ViewMetrics gives you different formats to suit your style. After that, click on “Create Report.”
Step 5: Review Your Final Report
Within a few moments, your end-of-the-year report will be ready. Go through it to check performance trends, highlights, and areas that may need improvement. You can share or download the report directly from the dashboard to present it to your team or clients.
View All Your Marketing and Website Data - Instantly
Connect Instagram, Mailchimp, Google Analytics & more
Pre-built dashboards, no setup needed
Save hours on reporting every week
Why a Year-End Marketing Report Matters?

Here’s why creating a year-end marketing report matters:
-
Understanding Performance
A year-end report shows how your marketing efforts actually performed. It helps you see which campaigns worked well, which didn’t, and what kind of return you got on your time and budget. By comparing goals with outcomes, you can clearly measure success.
-
Informed Decision-Making
When you have the full picture of your performance, your next steps become smarter. Data-driven insights from your report help you decide where to invest, what to adjust, and which ideas to drop. Instead of guessing, you start making confident choices backed by numbers and outcomes.
-
Aligning Future Goals
Your report connects the dots between past performance and future plans. By reviewing what you achieved this year, you can set realistic goals for the next one. It also helps make sure your short-term marketing actions actually support your long-term business objectives.
-
Accountability
Whether you’re working solo or with a team, a report holds everyone accountable. It lays out what was planned, what happened, and where the gaps were. No guesswork, just clarity.
-
Strategic Alignment
Your marketing should support bigger business goals. A clear year-end report shows how well your efforts are aligned with overall company strategy, helping everyone stay on the same page.
-
Internal and External Communication
Reports make communication smoother. Internally, they keep your team on the same page. Externally, they help you share results with clients, investors, or partners in a clear, professional way.
Best Practices for End-of-the-Year Marketing Reporting

Once you know why your report matters, the next step is to make sure it’s done right. Here are some simple best practices to help you put together a strong and useful year-end marketing report:
-
Be Consistent
Keep your reporting format and metrics consistent year after year. It makes comparison easier and shows growth clearly. Use the same KPIs and structure so that trends stand out without confusion.
-
Vanity Metrics Are Just That
Don’t let shiny numbers fool you. High follower counts or likes might look good, but they don’t always mean progress. Focus on metrics that tie directly to goals like leads, conversions, engagement quality, and return on investment.
-
Focus on Year-over-Year Trends
Instead of looking at data in isolation, compare it to last year’s performance. Year-over-year trends show whether your strategies are improving or need tweaking. This perspective helps you measure true growth over time.
-
Data to Insights to Action
Numbers alone don’t help much until you interpret them. Highlight what the data means and what actions you’ll take next. For example, if email click rates dropped, discuss why and what you plan to do differently next time.
-
Illustrate Your Results
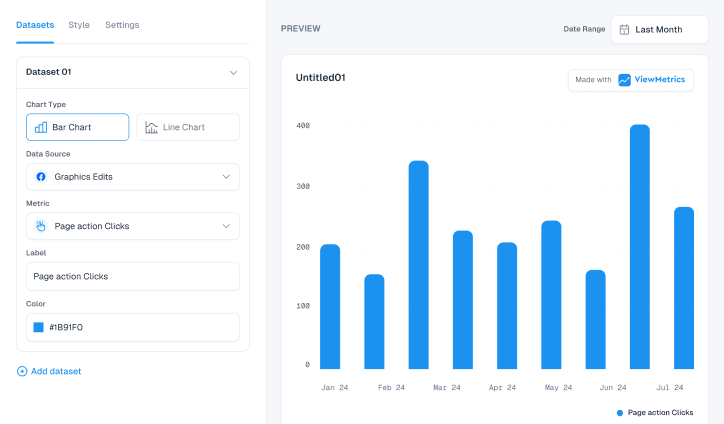
Visuals make your report easier to read and understand. Use graphs, charts, and infographics to highlight patterns and achievements. A clear visual story often says more than a page full of numbers.
-
Marketing Dashboards and Templates
Using templates or dashboards can save time and ensure accuracy. Tools like ViewMetrics or other reporting platforms can automate data collection and visualization. This helps you focus more on analysis and less on manual work.
Read related: 11 Best Report Automation Tools to Boost Insights in 2025
Closing Thoughts
A year-end marketing report is more than just a wrap-up. It brings together your efforts, data, and insights into one clear story. When done right, it helps you understand where you stand and what to do next. It also sets the tone for your future campaigns by showing you what to carry forward and what to leave behind. Take this as a chance to reflect, learn, and build a stronger plan for the coming year.
Frequently Asked Questions (FAQs)
-
What is the difference between a year-end marketing report and a quarterly marketing report?
A year-end marketing report looks at your entire year’s performance, covering overall strategies, results, and outcomes. On the other hand, a quarterly report breaks the year into smaller chunks, tracking progress every three months. It helps you spot short-term trends and adjust plans more often.
-
How often should you use charts and graphs in the report?
Use visuals whenever you can. Charts and graphs make it easier for readers to understand data, see patterns, and grasp your message quickly. They also make the report more engaging and easier to read.
-
Should social media analytics be part of the end-of-year marketing report?
Yes, definitely. Include your social media performance such as reach, engagement, follower growth, and campaign results. It helps show how your online presence supported your overall marketing goals throughout the year.
-
How do you present ROI in a year-end marketing review?
You can show ROI by comparing your marketing costs to the revenue or conversions they generated. Use simple tables or graphs to make this comparison clear. This helps stakeholders see the real impact of your marketing efforts.
-
Should an end-of-the-year marketing report include competitor analysis?
Yes, it should. Adding competitor analysis helps you understand where your brand stands in the market. Comparing your results with competitors’ or industry benchmarks can highlight strengths, weaknesses, and areas for growth.
-
Should the year-end report be a PDF, slide deck, or live presentation?
That depends on your audience. A PDF works well if you’re sharing a detailed document. A slide deck is great for presenting in meetings, and a live dashboard works best for interactive discussions where you want to explore data in real time.


