Running Google Ads is one thing, but knowing how your campaigns are doing is a whole different game. If you’re spending money on ads, you need a clear and simple way to track what’s working and what’s not. That’s where a good Google Ads report comes in. In this blog, we’ll walk you through how to create a report that gives you the right insights. Whether you’re managing one campaign or several, this will help you stay in control and make smarter decisions.
What Are Google Ads Reports?
Google Ads Reports are customisable performance dashboards within the Google Ads platform that provide real-time insights into advertising campaigns. These reports track and display key metrics such as clicks, impressions, cost-per-click (CPC), conversion rate, and return on ad spend (ROAS). Advertisers use these reports to measure campaign effectiveness, identify trends, and optimise bidding, targeting, and ad creatives.
What to Include in Google Ads Reports?
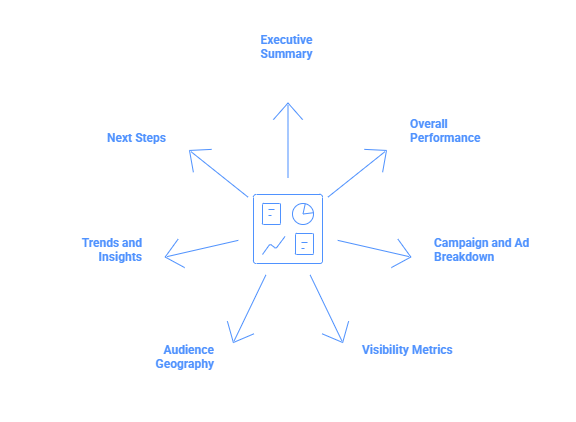
Here’s everything you should include in your Google Ads report to track performance, spot trends, and plan your next steps.
-
Executive Summary
Start with a short overview. Tell your reader what the report is about in simple language. Mention the goal of your ads, how they performed, and whether results improved or dropped. Think of this as your quick elevator pitch that anyone can read and get the gist of your campaign’s status.
-
Overall Performance
Now dig into the numbers. Show metrics like clicks, impressions, click-through rate (CTR), conversions, and cost per conversion. Compare current results with the previous period. Add simple graphs or tables if you can. This helps readers see what’s working and where changes are needed.
-
Campaign and Ad Breakdown
Break down performance by campaign, ad group, and individual ads. Highlight which campaigns performed best and which ones need attention. This gives a clearer picture of what kind of messaging or targeting works well.
-
Visibility Metrics
Now look at how often your ads were seen. Include impressions, reach, and frequency. This tells you how many people saw your ad and how often they saw it. If one person sees the same ad too many times, they might start ignoring it, so it’s useful to keep an eye on this.
Also Read – 15 Top Google Ads KPIs to Track in 2026 to Improve Ad Performance
-
Audience Geography
Tell your reader where your clicks or conversions are coming from. Show performance by city, state, or region. This is helpful for deciding if you need to adjust location targeting or spend more in areas that respond better.
-
Trends and Insights
Look for patterns. Are more people clicking in the evenings? Are conversions rising after certain ads? Point out what’s changed, what improved, or what dropped. This part is about making sense of the data and drawing conclusions you can act on.
-
Next Steps
End with clear recommendations. Based on the data, what should happen next? Maybe it’s testing new ad creatives, increasing budget for high-performing campaigns, or pausing low performers. This part shows your plan going forward.
How to Create a Google Ads Report (Step-by-Step)
If you’re running paid campaigns, reporting is just as important as setting up the ads. Here’s how you can create a proper Google Ads report that’s easy to understand and useful for decision-making.
-
Start with a Clear Goal
Don’t open the Report Editor just yet. First, ask yourself:
“What do I need this report to show?”
Some examples:
- Are my search campaigns hitting the target CPA?
- What’s the month-over-month change in ROAS?
- Which ad groups are wasting spend?
Reports generally fall under one of these goals:
- Efficiency: CPC, CPA, cost per conversion
- Volume: Clicks, impressions, conversions
- Profitability: ROAS, conversion value
- Visibility: CTR, impression share, position
Knowing your goal helps you choose the right data in the next steps.
-
Log in to Google Ads and Open the Report Editor
Go to your Google Ads account.
Click the Insights & reports icon (it looks like a graph) on the top menu.
Then select Report editor. You’ll land on a blank workspace where you can start building your table or chart.
-
Select the Right Metrics and Dimensions
Inside the Report Editor, drag and drop your data:
- Rows/X-axis (Dimensions): Campaign, Ad group, Keyword, Device, Location
- Columns/Series (Metrics): Clicks, Impressions, CTR, Conversions, CPA, Cost, ROAS, Conv. value
You can also apply filters to narrow the view, like showing only mobile traffic, a specific campaign type, or brand keywords. Filters help your report stay focused and aligned with the original goal.
-
Organize and Save Your Report Template
Arrange your columns in a way that tells a story. One example layout:
Impressions → Clicks → CTR → Cost → Conversions → CPA
Once you’re happy with the structure, save the report with a clear name like:
“April 2026 – Search Campaign Performance”
If you’re working inside a manager account (MCC), you can even pull in data from multiple linked accounts into one report.
-
Add Context: Goals and Budget Insights
A report filled with numbers isn’t enough. Add some context to make it actionable:
- Include benchmarks like Target CPA = $40 or Target ROAS = 400%
- Add custom columns like “CPA vs Target” or “ROAS Difference.”
- Highlight campaigns that are overspending, underspending, or generating poor returns
You can also use calculated fields to surface insights directly inside the report. And if you’re working in Google Sheets, you can push this further with formulas or scripts to break down performance by budget segments.
-
Add Visuals (Only if They Help)
Click the chart icon in the Report Editor to switch from table to visual mode. You can choose:
- Line charts to show trends over time
- Bar or column charts to compare campaigns or devices
- Pie charts for simple breakdowns like network or device share
Keep it simple. If a chart makes the data easier to understand, use it. If not, stick to tables.
-
Share or Export Your Report
Once your report is ready, you can share it in a few ways:
- Give access inside Google Ads to teammates or clients
- Export the report as a CSV, Excel file, or Google Sheet
For live dashboards, use the Google Ads add-on in Google Sheets. It lets you connect your report directly and pull in fresh data every time the file is opened.
-
Automate the Delivery
To avoid repeating this process every week or month:
- In the report settings, select how often the report should run (daily, weekly, or monthly)
- Add email addresses of the people who need to receive it
- Choose your preferred file format (CSV, Excel, or send directly to Google Drive)
Once this is set, your reports will run on autopilot with the latest data without manual exporting needed.
What Are the Benefits of Google Ads Reports?
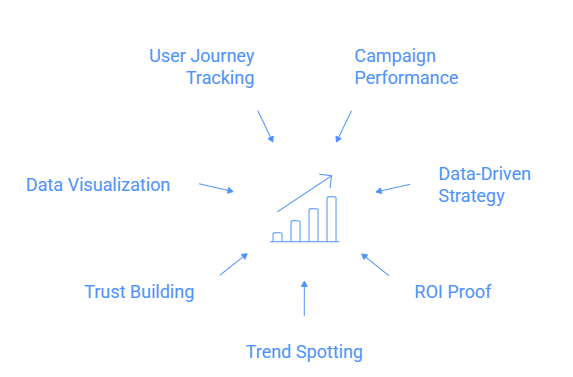
If you’re running paid campaigns on Google, you can’t just set them up and hope for the best. That’s where Google Ads reports come in. Here’s a closer look at the benefits:
-
Understand Campaign Performance
Google Ads reports break down how your campaigns are doing. You’ll see data like impressions, clicks, conversions, CTR, and CPC. These numbers give you a clear view of what’s actually bringing results.
-
Improve Strategy with Real Data
By looking at the report, you can spot which keywords or ads are underperforming. This helps you adjust your targeting, bids, and budget to focus only on what brings value.
-
Prove Your ROI
When clients or managers ask how their money is being spent, you can show the exact impact with these reports. It’s your proof that the budget is being used wisely and results are being delivered.
-
Spot Trends and Fix Issues Early
Over time, reports help you notice patterns. Maybe a certain time of day brings more clicks or some pages have higher bounce rates. This helps you take action quickly before things get worse.
-
Build Trust with Transparency
When you regularly share honest reports, people start trusting you more. They can see the wins and the gaps, and that builds confidence in your work.
-
Visualise the Data
Instead of scrolling through rows of numbers, you can use built-in charts and tables to make sense of the data. It helps you and others make faster and smarter decisions.
-
Track the Full User Journey
You can connect Google Ads with Google Analytics to see what users do after clicking your ad. Do they explore your site, bounce, or convert? This gives a full picture of what’s really happening.
Common Mistakes to Avoid While Creating a Google Ads Report
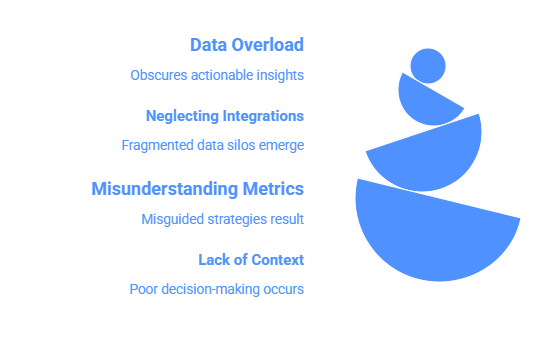
Even a well-designed campaign can lose its impact if the report doesn’t tell the full story. Avoiding these common mistakes can help you create reports that are clear, useful, and actually lead to better decisions.
-
Data Overload
Including too much data can overwhelm the reader. If your report is packed with every possible metric, it becomes hard to find what truly matters. Focus on what aligns with the campaign goals, like conversions, cost-per-click, or return on ad spend, so that the report stays clear and easy to act on.
-
Neglecting Cross-Platform Integrations
If you’re only reporting Google Ads data without linking it with Google Analytics or other platforms, you’re missing the full picture. You need to understand what users do after clicking the ad. Without this, you’re only reporting clicks, not actual results like purchases, signups, or page views.
-
Misunderstanding Metrics
Metrics like impressions, CTR, or bounce rate can be misleading if you don’t fully understand what they represent. For example, a high CTR is good, but if those clicks don’t convert, it’s not enough. Always tie metrics back to campaign goals and make sure you know what each one truly indicates.
-
Lack of Context
Numbers without context don’t tell much. Saying your ad got 5,000 clicks doesn’t help unless you explain whether that was better or worse than before. Add benchmarks, goals, or past performance to give your report meaning. This helps stakeholders understand if things are improving or falling behind.
Best Tools for Google Ads Reporting
-
ViewMetrics
ViewMetrics is made for teams and agencies that handle a lot of Google Ads data. It gives you real-time dashboards, detailed conversion tracking, and clear performance summaries. What sets it apart is how easy it is to find patterns, spot what’s not working, and send out automated reports without much effort. It also lets you pull in data from different ad platforms, which is helpful if you’re running ads across multiple channels. Everything is presented in a way that makes sense, without needing advanced analytics skills.
-
Google Ads Report Editor
This one is built right into your Google Ads account. You can drag and drop data, apply filters, and build pivot-style reports without opening another tool. It’s great for quick check-ins and comparing things like device performance, locations, or ad groups. If you want fast answers straight from the source, this is a solid option. While it’s not as visual or flexible as third-party tools, it works well when you just need to see what’s going on in your account right away.
-
Google Looker Studio
Formerly known as Data Studio, this free tool from Google helps you turn your ad data into clean, shareable reports. It connects easily with Google Ads, Analytics, Sheets, and more. You can build interactive dashboards that update on their own, and then share them with your team or clients. With charts, tables, filters, and templates, you can build exactly the kind of report you need. It’s especially useful if you want to bring in data from other sources too and get a more complete picture of how your ads fit into the bigger marketing picture.


 Connect Instagram, Mailchimp, Google Analytics & more
Closing Thoughts
Setting up a Google Ads report from scratch might feel like extra work at first, but it’s one of the best habits you can build as an advertiser. A clear report helps you understand what’s really happening with your budget, spot problems early, and make better decisions based on real data. Once you set up the right structure and automate delivery, reporting becomes simple and consistent. Over time, this will help you run smarter campaigns, improve results, and stay in full control of your ad performance.
Frequently Asked Questions (FAQs)
-
How often should I make Google Ads reports?
If you’re running active campaigns or spending a lot, go for weekly or biweekly reports. For most businesses, once a month is enough.
-
What does overall performance mean in a report?
It’s a summary of total ad spend, number of conversions, cost per acquisition (CPA), return on ad spend (ROAS), and click-through rate (CTR) across all campaigns.
-
How can I show trends in the report?
Compare your numbers over time. You can use month-over-month or year-over-year data to spot what’s improving and what’s not.
-
Should I include campaign-level data?
Yes, always include it. It shows which campaigns are working well and where you might need to shift your budget.
-
How do I add audience and location data?
Use filters to show performance by location, device type, or audience segments. This helps you understand which users are giving you the best results.
-
What should I say if the performance is poor?
Be honest, but explain the bigger picture. Maybe you tried a new strategy, changed your budget, or faced tough competition. Show you’re learning from it.