Key Takeaways
- LinkedIn Ads reports help you track campaign performance across impressions, clicks, leads, conversions, and spend.
- Focus on metrics that match your campaign goal instead of pulling every available data point.
- Audience insights like job title, industry, and company size help refine targeting.
- Tools like ViewMetrics make LinkedIn Ads reporting easier when managing multiple campaigns or teams.
- Regular reporting helps you optimise campaigns, control costs, and improve ROI over time.
If you’re just starting out with LinkedIn Ads, tracking performance might seem confusing at first. But don’t worry. In this blog, we’ll walk you through how to create a LinkedIn Ads report and explain everything you need to know to get useful insights from it. Whether you’re running one campaign or many, this guide will help you understand what’s working and what needs a fix. Let’s jump right into it.
What is LinkedIn Ads Report?
A LinkedIn Ads Report is a detailed summary of how your LinkedIn advertising campaigns are performing across different metrics like impressions, clicks, leads, conversions, cost-per-click (CPC), and return on ad spend (ROAS). Marketers use this report to understand which ads are working, which audiences are engaging, and how much value the campaign is generating. It breaks down performance by campaign, ad type, targeting criteria, and budget so you can make smarter decisions and improve future campaigns. You can generate these reports directly in LinkedIn Campaign Manager and export them in formats like CSV or Excel.
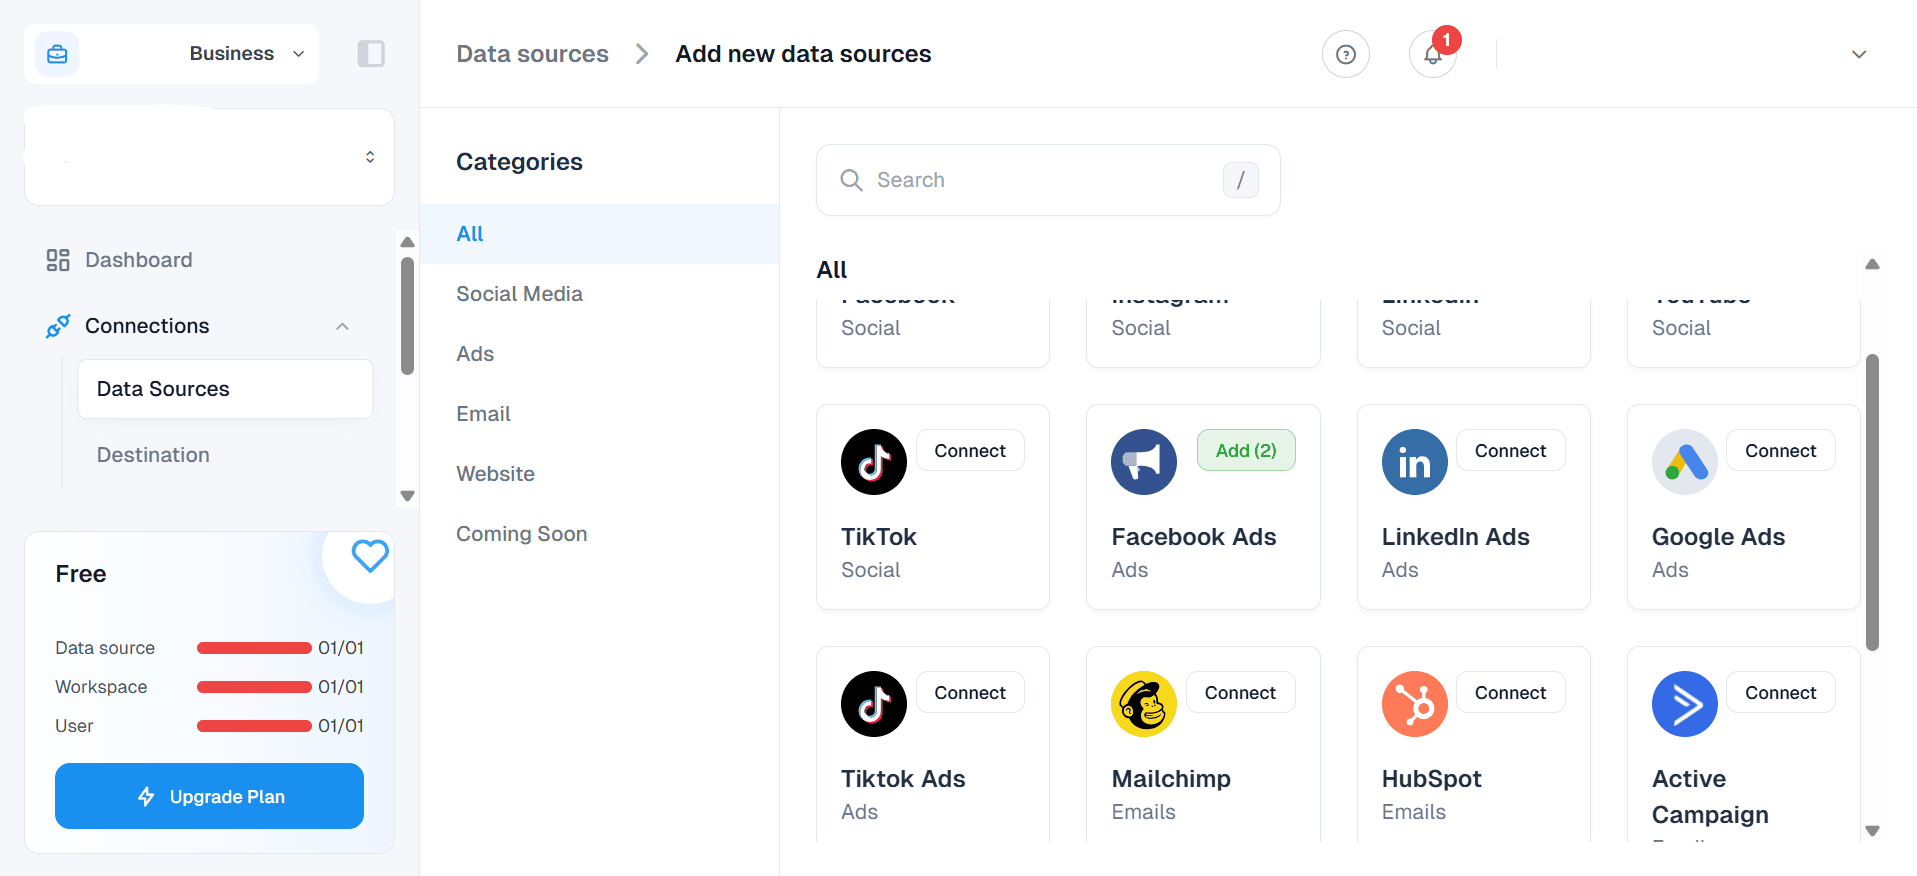
What to Include in a LinkedIn Ads Report?
A good LinkedIn Ads report should give a clear view of how your campaigns are performing, how they’re contributing to business goals, and what to improve next. Here’s everything you need to include:
-
Performance Summary
This section gives an overview of how your ads performed in terms of visibility and user actions.
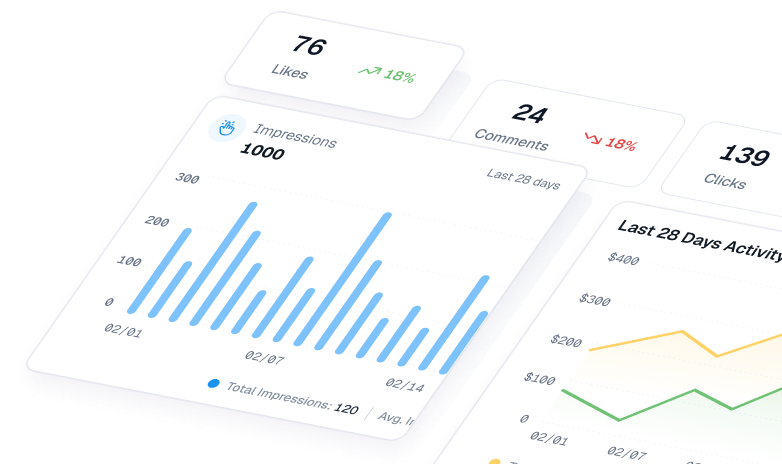
- Impressions & Reach: Track how many times your ads were displayed (impressions) and how many unique people saw them (reach). This helps you understand how far your campaign is spreading.
- Clicks & CTR (Click-Through Rate): Show the total number of clicks and calculate the CTR. CTR = (Clicks ÷ Impressions) × 100. A higher CTR means your ad message is connecting with the audience.
- Spend: Include the total money spent across campaigns. Break this down by day or campaign if needed.
- Engagement: Measure actions like likes, comments, shares, and video plays. These show how users are interacting with your content, not just viewing it.
-
Conversion & Lead Metrics
This section focuses on what actions people are taking after clicking your ads.
- Conversions: List the number of important actions taken, such as form submissions, sign-ups, or purchases. Define what counts as a conversion.
- Conversion Rate: This tells you how many clicks actually led to conversions. It’s useful for judging ad quality and landing page performance.
- Cost Per Lead (CPL) / Cost Per Conversion: Calculate how much you’re spending to get each lead or action. Lower costs often mean better ROI.
- Lead Gen Form Metrics: If you’re using LinkedIn Lead Gen Forms, show how many people opened and submitted the form, and how many were qualified leads. Completion rate helps assess form length and clarity.
-
Audience & Engagement Details
Understanding who interacted with your ad is just as important as what they did. Make sure you include:
- Demographics: Break down engaged users by job title, industry, company size, and location. This tells you if your campaign reached the intended audience.
- Campaign/Ad Group Performance: Compare how different ad sets or targeting options performed. Highlight top and low performers. This will guide future targeting and creative decisions.
-
ROI & Business Impact
This part usually needs CRM integration or backend data, but it brings real clarity to business results.
- Return on Ad Spend (ROAS): Show the revenue generated compared to the ad spend. ROAS = Revenue ÷ Spend. This metric links marketing to business goals.
- Pipeline Metrics: Highlight leads that turned into opportunities, deals won, or overall influenced revenue. If possible, show how many qualified leads moved into the sales funnel and the revenue impact.
How to Create a LinkedIn Ads Report?
Follow these steps to create a solid LinkedIn Ads report:
Step 1: Define the Goals
Before you open any dashboard, get clear on what the report is meant to track. Are you trying to show brand awareness, generate leads, or measure conversion from a specific campaign? Your goals will guide what data you focus on. Avoid pulling every available metric. Focus only on what matters to your campaign objectives.
Examples of clear goals:
- Track lead generation performance from a sponsored content campaign
- Measure job applicants driven by a LinkedIn job ad
- Monitor awareness for a product launch campaign
Step 2: Select the Key LinkedIn Ads Metrics
Once goals are clear, choose the right metrics to match them. Don’t overload your report with unnecessary numbers. Pick metrics that give a direct answer to your campaign questions.
Some useful LinkedIn Ads metrics:
- Impressions and Clicks
- Click-Through Rate (CTR)
- Cost Per Click (CPC)
- Conversion Rate
- Cost Per Conversion
- Leads or Sign-Ups
- Video Views (if applicable)
- Demographics (by job title, company size, location)
Also Read – Master LinkedIn KPIs for Maximum Engagement and Growth!
Step 3: Choose a Marketing Reporting Tool That Works Well With LinkedIn Ads
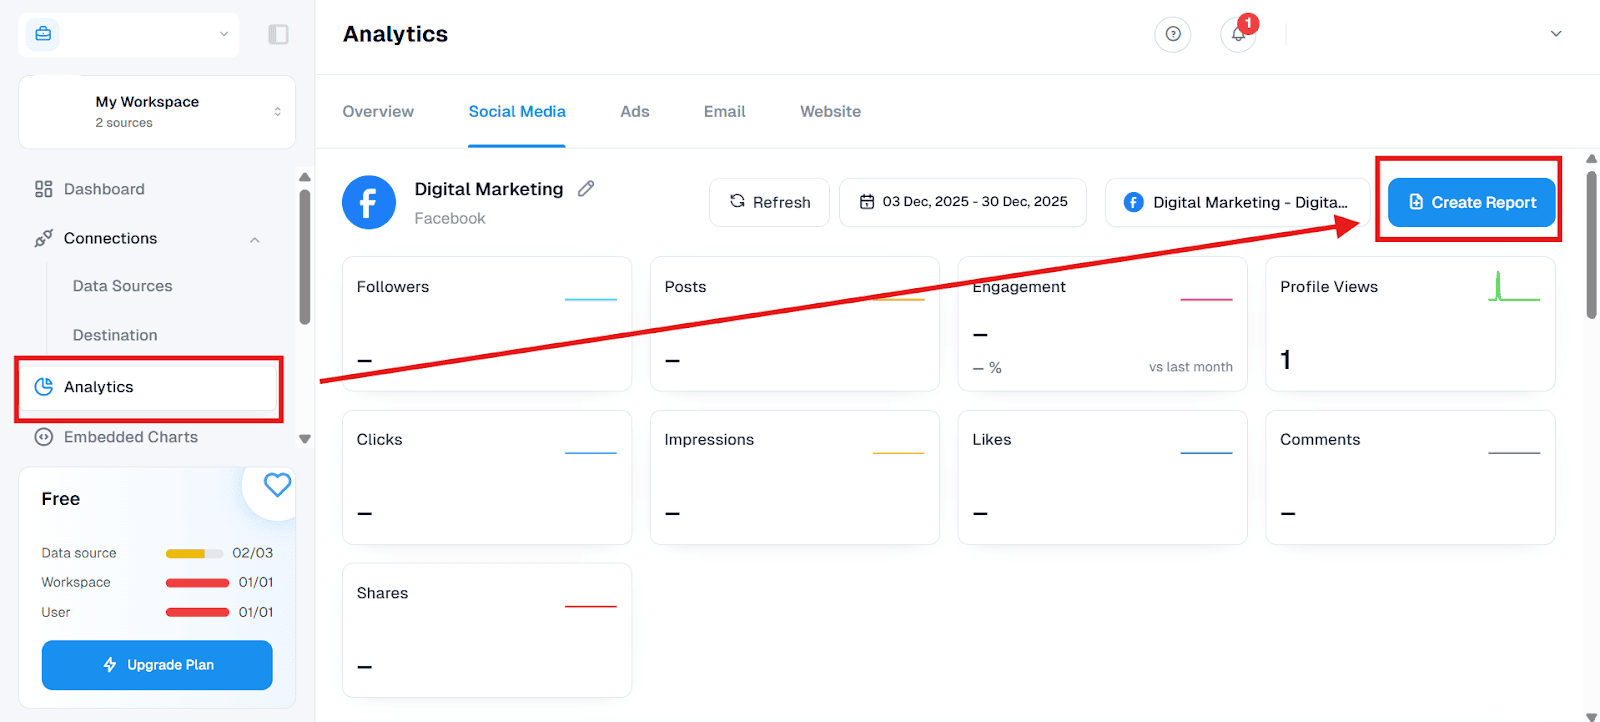
While LinkedIn Campaign Manager does offer built-in reporting, the process can get time-consuming if you’re running multiple campaigns. That’s where tools like ViewMetrics come in handy.
ViewMetrics connects directly with your LinkedIn Ads account and pulls campaign data into easy-to-read dashboards. It helps you visualise performance, compare campaigns, and drill down into specific metrics like lead cost, engagement trends, or demographic splits. You can also combine LinkedIn data with insights from other platforms like Google Ads or Meta if needed.
For busy teams, ViewMetrics saves time by removing manual work and giving everyone a real-time view of what’s happening. Whether you want a quick weekly snapshot or an in-depth performance review, it makes reporting smoother and easier to manage.
Also Read – 10 Best LinkedIn Analytics Tools in 2026 for Marketers & Agencies
Step 4: Use a LinkedIn Ads Report Template
Instead of building from scratch, use a ready-made report template. Most tools (and even LinkedIn itself) offer templates that include important visualizations and metrics. This helps you present data in a clean and professional format.
What a good template usually includes:
- Campaign overview
- Top-performing ads
- Budget and spend analysis
- Engagement metrics
- Lead or conversion tracking
- Audience insights
You can customise templates to suit different teams, like sales, leadership, or marketing.
Step 5: Automate Your Report Delivery
Instead of downloading and sending reports manually each time, automate it. Most tools allow you to set up scheduled reports daily, weekly, or monthly that go straight to your inbox or to other team members.
Benefits of automating reports:
- Saves time on repetitive tasks
- Ensures consistent delivery
- Keeps everyone in the loop without effort
You can also adjust report timing based on your campaign cycle.
How to Create a LinkedIn Ads Report Using ViewMetrics?
Here’s how you can use ViewMetrics to create a LinkedIn Ads report that stands out:
Step 1: Create or Log in to Your ViewMetrics Account
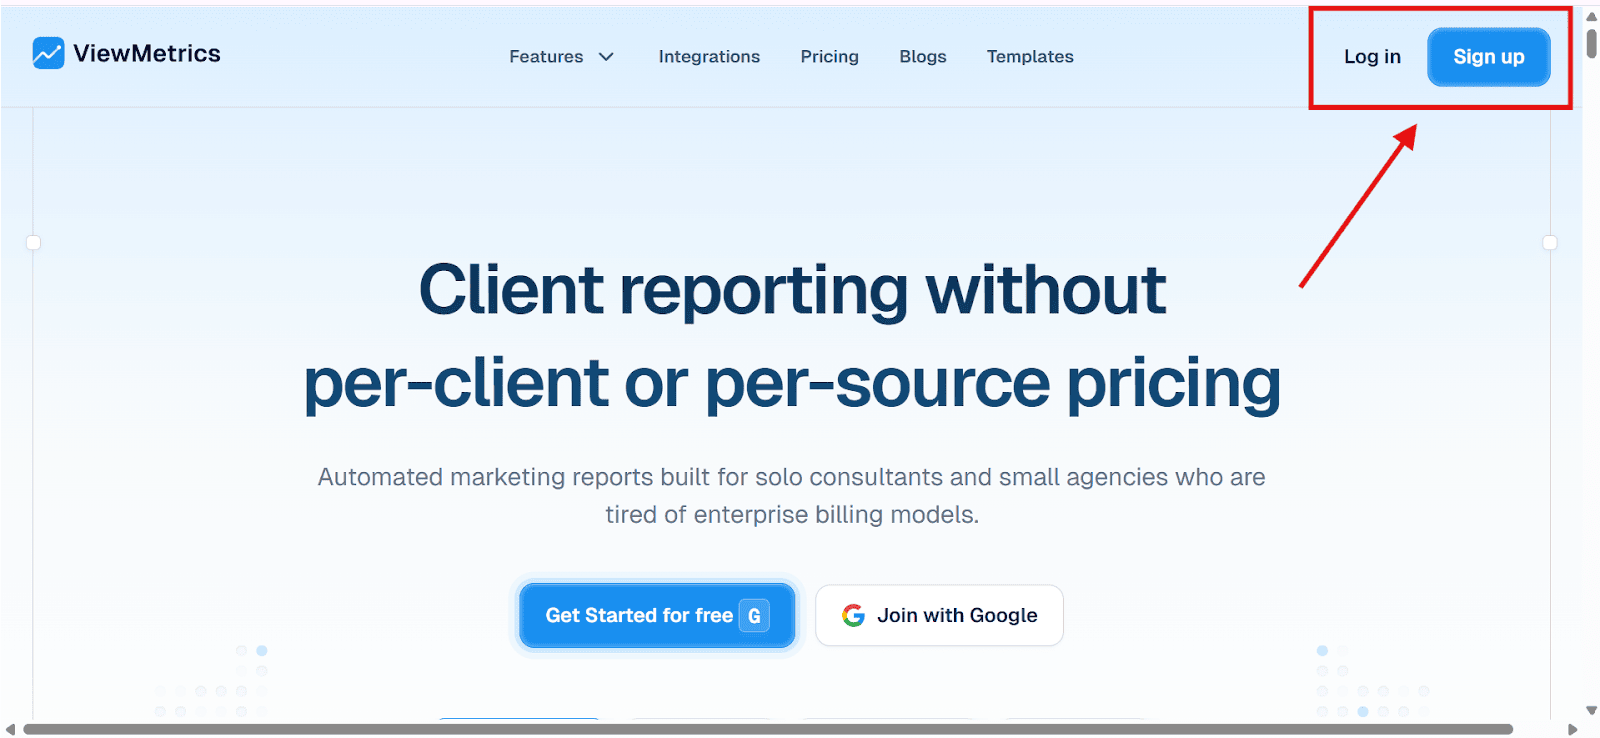
Start by visiting the ViewMetrics website. If you already have an account, go ahead and log you’re new, you’ll need to sign up with your email address and follow the prompts to verify your identity. The dashboard opens once you’re in.
Step 2: Connect Your LinkedIn Ads Account
To pull data from LinkedIn, you need to connect your LinkedIn Ads account. Go to the integrations section inside ViewMetrics, find the LinkedIn Ads option, and click on “Connect.” You’ll be redirected to LinkedIn to authorise access. Once done, ViewMetrics will be able to access your ad performance data securely.
Step 3: Link Your Google Drive
Next, link your Google Drive so that your reports can be automatically saved there. In the same integrations area, select Google Drive and follow the connection steps. You’ll be asked to grant permission so that ViewMetrics can create and store files in your Drive.
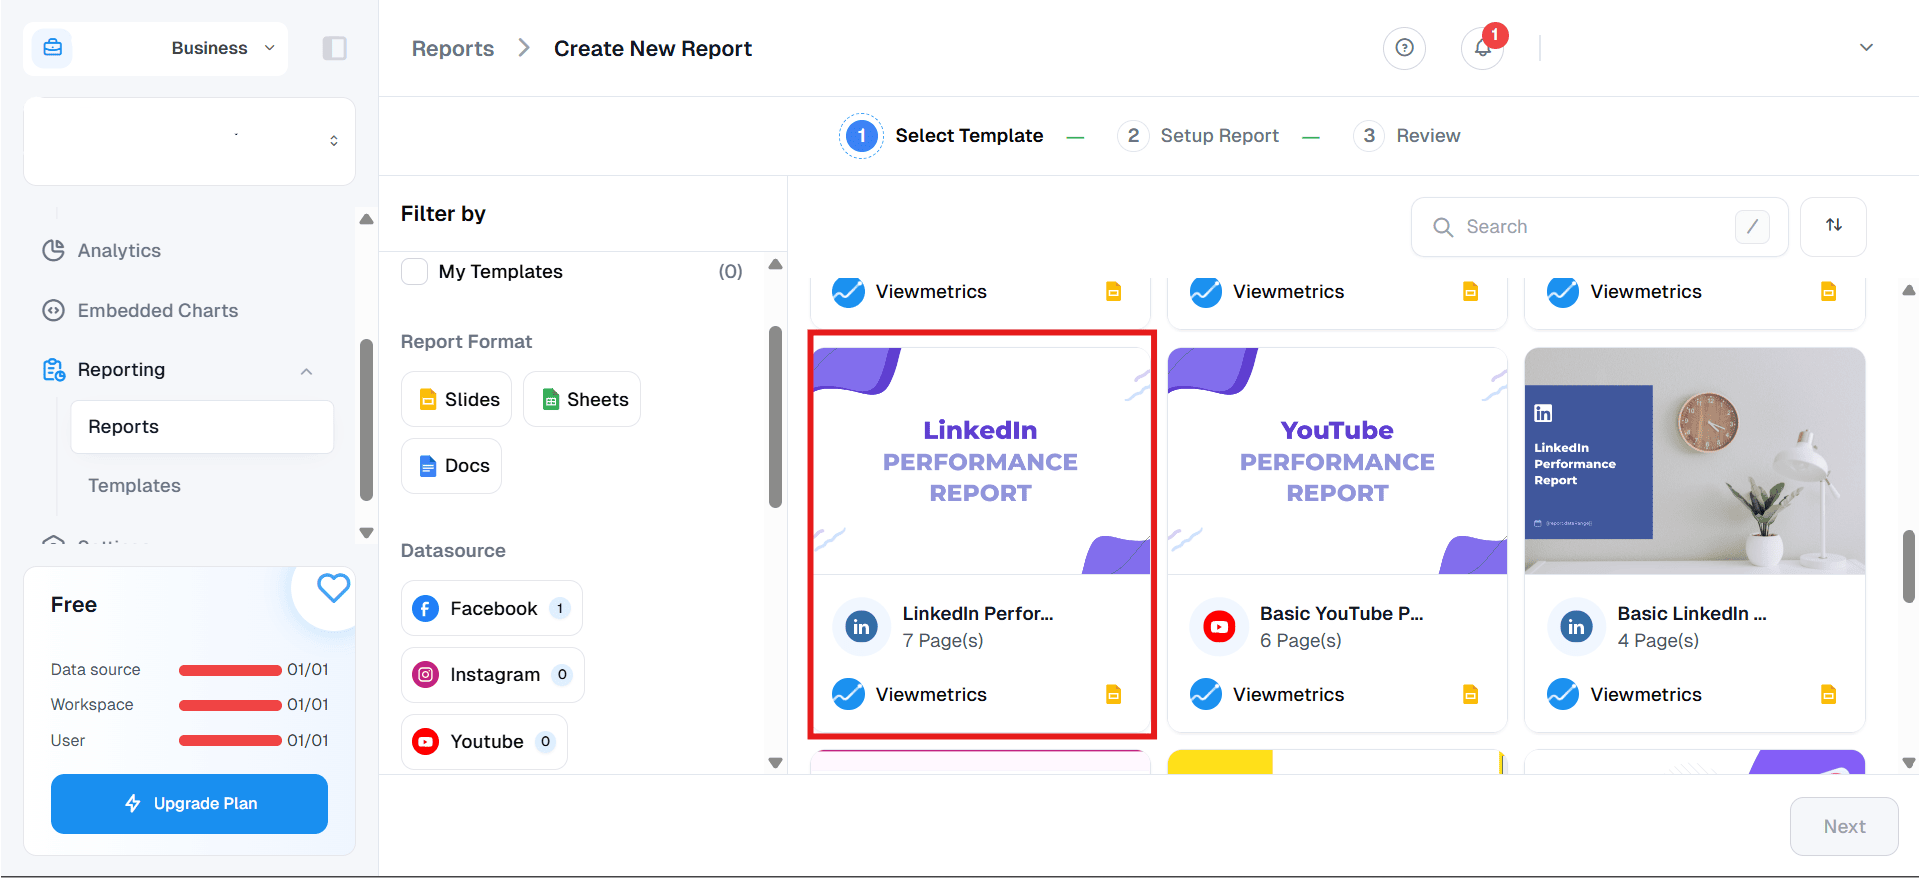
Step 4: Create a New Report
On your dashboard, click “Create New Report.” You’ll be asked to name your report and choose what type of report you want. Select “LinkedIn Ads” as your focus. This opens up a setup window where you can configure your data preferences.
Step 5: Choose Your Data Source and Time Range
Now choose the LinkedIn Ads account you just connected. Then, select the time range for your report. This could be the last 7 days, this month, last month, or a custom date range, depending on your campaign needs.
Step 6: Pick Your Report Format
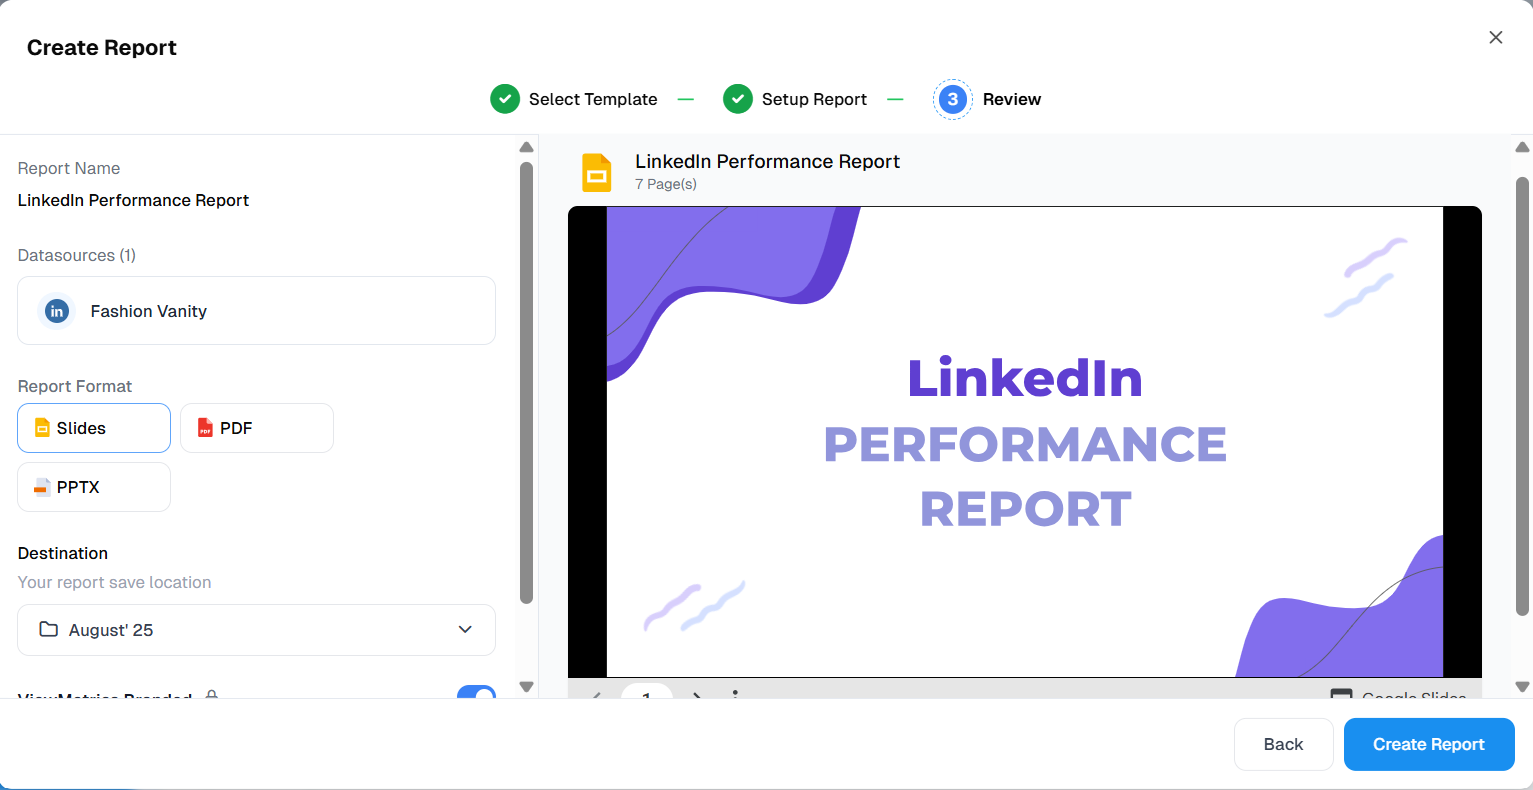
ViewMetrics gives you options for how your report will look. You can choose from Google Sheets, PDF, or Slide decks. If you’re presenting results to a team or client, Slide decks are a good choice. If you want to analyse the data deeply, Google Sheets will work better.
Step 7: Access and Share
Once the report is generated, it will be saved in your connected Google Drive. You can open it directly from there or access it through the ViewMetrics dashboard. From Google Drive, you can share the report using a link or by adding collaborators directly. This makes it easy to keep your team updated without manual exports or back-and-forth emails.


View All Your Marketing and Website Data - Instantly
 Connect Instagram, Mailchimp, Google Analytics & more
- Pre-built dashboards, no setup needed
- Save hours on reporting every week
Why Do You Need a LinkedIn Ads Report?
Here’s why you need a proper LinkedIn Ads report to make your campaigns work smarter:
-
Measure What Matters
You need to know what’s working. A LinkedIn Ads Report helps you track impressions, clicks, click-through rates (CTR), and conversions. This tells you how your ads are performing in real time.
-
Prove Your Budget Was Worth It
LinkedIn Ads can be expensive. With clear reports, you can show how your ad spend turned into leads, sales, or new business opportunities. Attribution reports connect the dots between ads and results, helping you justify your budget.
-
Fix What’s Not Working
The report highlights which ads or audience segments are not performing well. This gives you the chance to shift your budget toward the creatives and audiences that are giving better results.
-
Know Your Audience Better
LinkedIn gives you a deep look into your audience. You can see job titles, industries, seniority, and company sizes of the people interacting with your ads. These insights help you create content that speaks to the right crowd.
-
Support Sales and ABM
Company-level engagement data in LinkedIn Ads reports can be shared with sales teams. If certain companies are clicking on your ads or visiting your pages, sales can prioritise outreach to those warm accounts. It supports smarter account-based marketing (ABM) efforts.
-
Plan Better Campaigns
The learnings from your current and past LinkedIn campaigns guide your next moves. You’ll know which ad types perform best, what kind of messaging works, and where to improve. This helps in aligning your campaign goals with your broader business strategy.
Closing Thoughts
Getting comfortable with LinkedIn Ads reporting takes a little time, but once you get the hang of it, everything starts making more sense. You stop guessing and start making decisions based on real performance. Even a simple report can show you where your money is going and what results you’re getting back. Start small, review your data regularly, and keep improving one campaign at a time. That steady approach is what turns LinkedIn Ads into a channel that actually works for your business.
Frequently Asked Questions (FAQs)
-
What metrics should I track in LinkedIn Ads reports?
Track impressions, clicks, CTR, CPC, conversions, cost per conversion, leads, and engagement rate.
-
How often should LinkedIn Ads reports be created?
Monthly reports work for most campaigns. Weekly reports are better for high-spend or lead-focused campaigns.
-
How do I track leads in LinkedIn Ads reports?
Use LinkedIn Lead Gen Forms, website conversion tracking, or connect your CRM.
-
How do I show trends in a LinkedIn Ads report?
Compare performance across time frames like weeks, months, or campaign phases.
-
What is a good CPC for LinkedIn Ads?
It depends on your industry and audience. LinkedIn CPCs are usually higher due to B2B targeting.
-
What mistakes should I avoid in LinkedIn Ads reporting?
Don’t rely only on vanity metrics. Always check audience performance and give clear next steps.
-
Can beginners create LinkedIn Ads reports?
Yes. Use LinkedIn Campaign Manager’s built-in tools or platforms like ViewMetrics to make it easier.