If you’re helping a client improve their local search visibility and improve local SEO KPIs, building a strong local SEO report is a great place to begin. Whether it’s for a small business or a larger organisation with multiple locations, this report helps highlight what’s working, what needs attention, and where to focus next. In this guide, we’ll walk through how to build a local SEO report and what exactly you should include to make it useful and actionable.
What Is a Local SEO Report?
A local SEO report is a structured document that tracks and measures a business’s visibility in local search results across platforms like Google Search and Google Maps. It includes data on local keyword rankings, Google Business Profile metrics, map pack visibility, website traffic from local queries, reviews and ratings, citations, and local backlinks. By analysing these elements, a local SEO report helps businesses understand their performance in specific geographic areas and make data-driven decisions to improve their online presence and attract more nearby customers.
What to Include in a Local SEO Report?
Here’s everything you should include in a local SEO report to track your visibility, traffic, and growth in your target area.
-
Local Keyword Rankings
Start with how your local keywords are performing. This includes both your main keywords (like “dentist in New York”) and supporting ones (like “kids dental care in New York”). Track where your site shows up on Google when people in your area search using these phrases. Over time, this tells you if your content and SEO efforts are working in your target locations.
What to include:
- Rankings for both primary and secondary keywords
- Breakdown by location (if you serve multiple areas)
-
Google Business Profile Performance
Your Google Business Profile (GBP) is one of the biggest drivers of local traffic. Make sure to include detailed insights from it. Look at how many people found your business, what they searched for, and how they interacted with your listing.
What to include:
- Total views (profile, photos, map)
- Search queries used to find your business
- Number of calls, direction requests, website visits
- Weekly or monthly trends
-
Local Map Pack Visibility
If you’re aiming to appear in the Google Local 3-Pack (the top three local listings that show up on maps), this section matters a lot. You want to know if your business is showing up and how that’s changing week to week.
What to include:
- Whether your business is in the top 3 results
- Position changes over time
- Frequency of appearance in the map pack
-
Website Traffic from Local Search
You’ll also want to check how many people are visiting your website from local search results. This helps connect your local SEO efforts to real results.
What to include:
- Number of organic visitors from local queries
- Top landing pages bringing in that traffic
- Devices used (mobile vs desktop)
-
Reviews & Ratings Analysis
Local customers trust reviews. That’s why it’s important to track both the number and quality of your reviews. See if they’re going up, what people are saying, and what that means for your reputation.
What to include:
- Total number of reviews and your average star rating
- How your review count has changed over time
- Sentiment analysis (positive, negative, neutral trends)
- Comparison with local competitors (if available)
-
Citations & NAP Consistency
NAP stands for Name, Address, and Phone Number. Search engines like Google care a lot about whether your business details are consistent across the web. So this part of the report focuses on where your business is mentioned and whether the info is accurate.
What to include:
- List of current citations (directories, listings)
- Any inconsistencies in NAP
- New citations gained
- Old citations that were lost or removed
-
Backlinks & Local Authority
Backlinks help search engines decide how trustworthy your website is. Local backlinks, like those from regional blogs, news sites, or community pages, are even more valuable. They show Google that your business matters in the local space.
What to include:
- New local backlinks acquired
- Anchor text and referring domain analysis
- Domain authority trends
- Changes in backlink quality over time
How to Create a Local SEO Report?
Here’s how to create a clear and actionable local SEO report for your clients in 2026.
-
Define Your Goals and Audience
Start with this: What matters most to your client? Don’t dive into metrics unless you know what success looks like for them.
Ask yourself:
- What kind of business is it? A single-location restaurant cares about phone calls and map directions. A service-based business needs reach across multiple ZIP codes.
- What actions actually bring in money? Bookings, form fills, in-store visits, or calls?
- Who’s reading the report? A local business owner might want simple charts and clear takeaways. An agency stakeholder might expect competitor analysis and next steps.
- How often will you report? Monthly is common, but some clients might want weekly or quarterly updates.
The more you tailor your report to the business’s actual goals, the more valuable it becomes. Skip the jargon if you’re reporting to non-technical clients. Instead of “Rankings Improved,” say “More people are finding you on Google.”
-
Pick the Right Metrics to Track
Not every number needs to be in your report. Choose only those metrics that connect directly to your client’s goals. Too much data only causes confusion.
Break your metrics into clear buckets:
-
Google Business Profile (GBP)
- Impressions (how often the listing appears)
- Website clicks
- Phone calls
- Direction requests
- Website visits through GBP
This data shows how many people are finding the business and taking action directly from search results.
-
Local Keyword Rankings
- Average Rank Position (ARP) for your top local keywords
- Visibility in the Local Pack (top 3 map results)
- Rank changes for each service area or location
Rankings should be viewed in context. A keyword like “best dentist near me” means something different downtown compared to the suburbs.
-
Organic Traffic (Geo-Based)
- Sessions from local keywords
- Bounce rate and page depth from local visitors
- City or ZIP code traffic breakdown
This shows where local SEO is working and where improvement is needed.
-
Online Reviews
- Number of reviews and how fast they’re coming in
- Average rating
- Sentiment trends
- How fast the business replies to reviews
Reviews are a trust signal for both users and Google. They’re worth tracking closely.
-
NAP Consistency (Name, Address, Phone)
- Are business listings accurate across all directories?
- Are there inconsistent versions like “Rd.” vs. “Road” or “Co.” vs. “Company”?
Even small mismatches can confuse Google and hurt local rankings.
-
Local Backlinks & Citations
- Links from relevant local sites like newspapers, blogs, and business groups
- Quality and authority of citations across directories
For large businesses, group your metrics into:
- Visibility: Rankings, impressions, map pack presence
- Engagement: Clicks, calls, direction requests
- Conversions: Form submissions, bookings, store visits
-
-
Collect Data from the Right Tools
You don’t need premium tools to get started, but they can help when you’re working with multiple clients or locations.
Free Tools
- Google Business Profile Insights: Clicks, calls, directions, visits
- Google Search Console: Keyword queries and search performance
- Google Analytics: Tracks location-based traffic and conversions
Paid Tools
- BrightLocal: Rankings, reviews, citation management (from $16/month)
- SEMRush Local Listings: Local keyword tracking and competitor insights (premium)
- Moz Local: Focused on citation cleanup and review analysis
- Local Falcon: Great for precise map rankings
Dashboard Tools
- Google Looker Studio: Custom dashboards that connect GBP, Analytics, and GSC
- Viewmetrics: Clean visual reporting (often used with clients)
Pro Tip: Use UTM tags on your GBP URLs (like utm_source=google_business_profile) to track traffic better in Google Analytics.
-
Structure Your Report Clearly
A good report guides the reader. Keep it tight, relevant, and focused on goals.
Suggested Layout
Page 1: Executive Summary
- Month or date range
- Big wins (e.g., “Calls up 30%”)
- Areas that need work
- Key recommendation for next month
Pages 2-4: Goal-Based Performance
- Break down visibility, engagement, and growth
- Use 1-2 charts per goal and 3-5 metrics
Page 5: GBP Deep Dive
- Show trends for impressions, direction requests, and calls
- Include review summaries and recent sentiment
- Highlight what’s working well
Page 6: Keyword Rankings
- Show movement for top 10-15 keywords
- Local Pack visibility stats
- Rank breakdown by neighborhood (if needed)
Pages 7-8: Traffic & Conversions
- How local search is bringing traffic
- Where that traffic is converting
- Breakdown by city, ZIP, or neighborhood
Page 9 (Optional): Competitive Insights
- Compare review scores and keyword ranks
- Mention any areas where a competitor is leading
Page 10: Action Plan and Insights (1 page)
- Celebrate 2-3 wins
- Flag 1-2 problem areas
- Recommend 2-3 specific things to do next
-
Make It Visual
Clients don’t want to read a wall of text. Use charts that help them see what’s happening.
Useful Visuals
- Line Charts: Show trends over time for things like clicks or calls
- Bar Charts: Compare current vs last month or top performing cities
- Scorecards: Use small boxes to show things like “Review rating = 4.7 stars,” “Phone calls = +25%”
- Tables: Good for showing full keyword lists, but keep them short
- Heat Maps: Show ZIP codes or regions with stronger local visibility
Stick to 1 message per visual. Add colour coding: green for improvement, red for decline.
Tools to use:
- Google Data Studio
- Viewmetrics
- SEMrush dashboards
-
Share Insights, Not Just Numbers
A report is only helpful if it leads to action. Use this simple format to explain what to do:
- What you observed: “Phone calls rose 25% this month”
- Why it matters: “This is the main way clients book services”
- What likely caused it: “We added FAQs and responded faster to reviews”
- What to do next: “Keep up responses and test a ‘Call Now’ banner on your site”
Other examples:
-
Problem: “Direction requests dropped.”
- Insight: A new competitor opened nearby.
- Action: Improve your review rating and encourage check-ins.
-
Opportunity: “Ranking #4 for a high-traffic keyword.”
- Action: Create a page targeting that keyword with location-based content.
-
Pattern: “60% of calls come on weekends.”
- Action: Add weekend-focused CTAs or promotions to your GBP posts.
-
Wrap Up with a Summary
End your report with a short summary that ties back to the original goal.
Your summary should answer:
- Are we on track? (Yes, No, or Partial)
- What’s going well?
- What’s the top opportunity for next month?
- What do we continue, start, or stop doing?
Example:
“This month saw solid growth. Calls are up 25%, and your rating has improved to 4.7 stars. One concern is a drop in direction requests, possibly linked to a nearby competitor. Your GBP visibility remains strong. Focus next month: create a dedicated landing page for ‘[Service] in [Neighbourhood]’ to tap into over 500 monthly searches.”
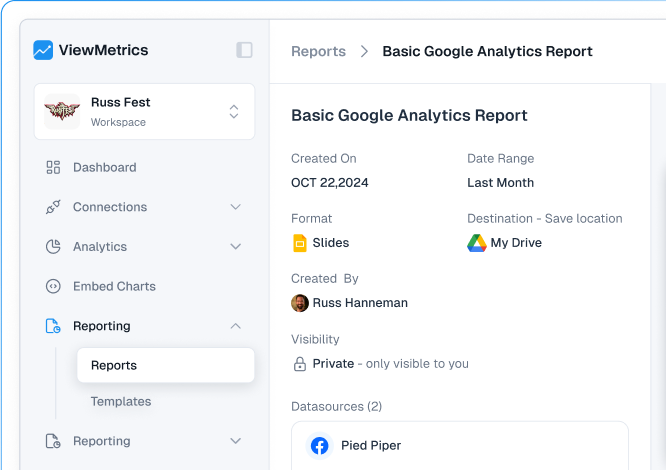
How ViewMetrics Helps With Local SEO Reporting
If you’re tired of copying metrics from five different tabs into a report every month, ViewMetrics can make your life easier. It pulls together all your local SEO data like Google Business Profile stats, Analytics, ads, and social media insights into one place. You only need to connect your data once. After that, ViewMetrics keeps everything updated on your preferred schedule, whether that’s daily, weekly, or monthly.
You can use your own templates in Google Sheets or Google Slides, or start with one of the pre-made options. ViewMetrics automatically fills in the charts, screenshots, and data so you don’t have to. Every report stays consistent and ready to go without you lifting a finger. Since the pricing is fixed and not based on the number of clients or data sources, it’s a great fit for solo consultants or agencies that handle multiple local SEO clients.
But ViewMetrics is not just about saving time. It is built for how real teams work. You can create separate workspaces for each client, invite team members when needed, and export charts instantly for client presentations. If your clients prefer hands-on access, you can give them embedded dashboards that do not require extra logins or complex tools. You can even match the reports to each client’s brand with customizable styles and layouts.
If your team needs to show clear, reliable results month after month, ViewMetrics makes the reporting process smoother, faster, and way less stressful.


View All Your Marketing and Website Data - Instantly
 Connect Instagram, Mailchimp, Google Analytics & more
- Pre-built dashboards, no setup needed
- Save hours on reporting every week
Closing Thoughts
At the end of the day, a local SEO report should make your next move obvious. If the numbers help you see what’s working, what’s not, and what to fix first, you’re doing it right. Keep it clear, keep it focused on real results, and use it as a tool to guide steady growth, not just as a document to send every month.
Frequently Asked Questions (FAQs)
-
How often should you create local SEO reports?
Once a month is a good starting point. It gives you enough data to spot trends, track progress, and take action. For new campaigns or clients, you might want to do it more frequently in the first few months.
-
What is the difference between an SEO report and a local SEO report?
An SEO report looks at your overall search visibility. A local SEO report focuses on how well you’re doing in a specific area or location, like showing up on Google Maps or local searches.
-
Can I create a free local SEO report?
Yes, you can. There are free tools out there that give you a basic report. These might not be as detailed, but they’re a good way to start tracking local performance.
-
What are the best tools for local SEO reporting?
ViewMetrics is one of the best tools you can use. It shows you local rankings, map pack visibility, and even competitor data. Other popular tools include BrightLocal, Whitespark, and Moz Local.
-
Are local SEO reports useful for multi-location businesses?
Absolutely. If your business has more than one location, these reports help you compare how each one is performing and where to focus next. They give a clear picture of what’s working and what needs attention.
-
What metrics matter most in local SEO reporting?
Focus on things like local keyword rankings, Google Business Profile performance, customer reviews, local backlinks, and map pack visibility. These give you a complete view of how visible your business is in your target area.