
Running a business today means dealing with a constant stream of data. Sales numbers, campaign performance, customer activity, team output, system health. It all adds up quickly. The real challenge is not collecting this data, but making sense of it in time to act on it. That is where operational dashboards come in. They bring everything into one place, help you track what is happening right now, and make it easier to respond without delays. When used well, they reduce guesswork and help teams move faster with more clarity.
What Is an Operational Dashboard?
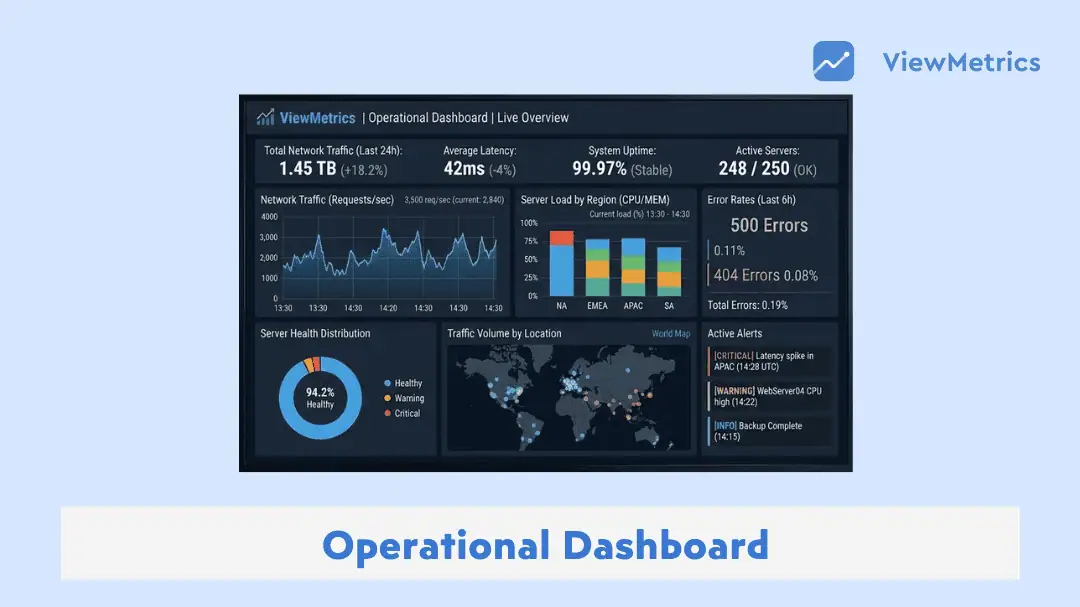
An operational dashboard is a tool that shows live or near-real-time data related to daily business activities. It helps teams keep track of ongoing work, spot issues early, and respond without delay. Instead of going through multiple reports, everything is visible in one view.
You can think of it as a control panel for your operations. It shows the current state of your processes, whether things are running smoothly or starting to slip. Managers and teams use it to monitor performance, track metrics, and make quick decisions when something needs attention.
Related Read – 4 Types of Dashboard
Examples of Operations Dashboard
Here are some examples of operations dashboards:
-
Marketing Operations Dashboard
Imagine a company running ads on Google, posting regularly on social media, and sending email campaigns every week. Each channel generates its own data. Without a central view, it becomes difficult to understand what is actually working.
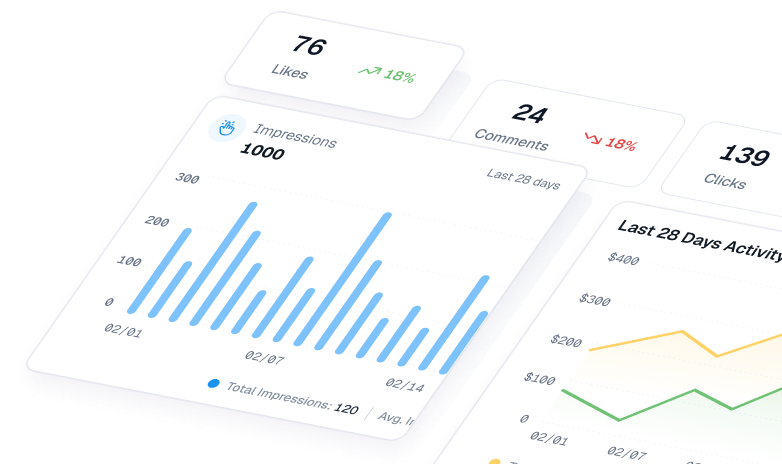
A marketing dashboard like ViewMetrics brings all of this into one place. You can view metrics such as Customer Acquisition Cost, conversion rate, leads generated, website traffic, cost per click, and campaign returns without needing to switch between tools.
If the dashboard starts showing rising acquisition costs or a drop in conversions for a specific campaign, the team can step in immediately. They can pause underperforming ads, adjust targeting, or tweak creatives. Acting early like this helps avoid wasted spend and keeps performance on track.
-
Sales Operations Dashboard
Sales teams deal with moving targets. Deals are opened, progress through stages, and either close or drop off. Keeping track of this manually can be time-consuming and slow things down.
A sales operations dashboard gives a clear view of the pipeline. It shows total pipeline value, deal stages, win rates, and how long deals are staying in each stage.
For example, if many deals are getting stuck at the negotiation stage, the manager can step in early. They might review pricing strategies, support the sales reps with better pitches, or address objections more clearly. Instead of discovering the issue at the end of the month, they fix it while it is happening.
Benefits of an Operational Dashboard
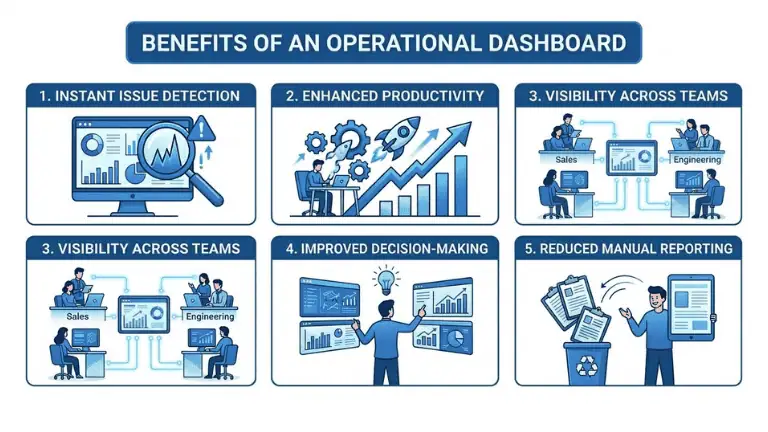
Here are some practical ways operational dashboards help teams work better.
-
Instant Issue Detection
Problems do not stay hidden for long. Whether it is a drop in sales, a spike in costs, or a system delay, dashboards highlight it as it happens.
-
Enhanced Productivity
Teams spend less time searching for data and more time acting on it. Decisions happen faster, and work moves forward without unnecessary delays.
-
Visibility Across Teams
Everyone works with the same numbers. This reduces confusion and keeps teams aligned on what needs attention.
-
Improved Decision-Making
When data is clear and up to date, decisions feel more confident. There is less guesswork involved.
-
Reduced Manual Reporting
Instead of creating reports again and again, dashboards update automatically. This saves time and reduces the chances of errors.
How to Create an Operational Dashboard?
If you are planning to build an operational dashboard, here is a simple way to approach it.
-
Define Operational Goals and KPIs
Start by identifying what you want to track. This could be sales performance, marketing efficiency, or customer support response time.
-
Identify the Most Important Metrics
Not every data point needs to be included. Focus on metrics that directly impact decisions.
-
Collect and Integrate Data from Multiple Sources
Your data may come from different tools. Bring it together so you get a complete picture.
-
Choose a Suitable Dashboard Tool
Pick a tool that supports real-time updates and integrates well with your existing platforms.
-
Design the Dashboard Layout and Visual Hierarchy
Arrange information in a way that feels natural. Important metrics should be easy to spot at a glance.
-
Add Charts, Graphs, and Visual Elements
Use visuals to simplify data. A well-placed chart can explain more than a table full of numbers.
-
Automate Data Updates and Reporting
Set up automatic updates so your dashboard always reflects the latest information without manual effort.
How ViewMetrics Helps Build Operational Dashboards?
If you are looking for a way to simplify dashboard creation, ViewMetrics can make the process much easier.
-
All Your Data in One Place
Instead of switching between platforms, you can bring data from different sources into a single dashboard. This makes tracking much simpler.
-
Real-Time Data Access
You do not have to wait for reports. ViewMetrics updates data continuously, so you always know what is happening.
-
Export-Ready Reports
You can push your dashboard data directly into tools like Google Slides or Sheets. This helps when sharing updates with teams or clients.
-
Centralized Metric Tracking
All important KPIs are visible in one place. You can monitor performance without jumping across tools.
-
Less Manual Work
Data collection and updates happen automatically. This reduces the time spent on repetitive tasks and lets you focus on analysis.


View All Your Marketing and Website Data - Instantly
 Connect Instagram, Mailchimp, Google Analytics & more
- Pre-built dashboards, no setup needed
- Save hours on reporting every week
Closing Thoughts
Operational dashboards are not just about displaying data. They help you stay aware of what is happening in your business at any given moment. When used properly, they reduce delays, improve coordination, and make everyday decision-making much smoother.
If your current process involves switching between tools or waiting for reports, moving to an operational dashboard like ViewMetrics can bring immediate clarity and control.
Frequently Asked Questions (FAQs)
-
What is the purpose of an operational dashboard?
The main purpose is to track daily activities and performance in real time. It helps teams monitor what is happening and respond quickly when something changes.
-
What are the types of Operational Dashboards?
Operational dashboards can vary based on the function they serve. Common types include marketing dashboards, sales dashboards, customer support dashboards, and supply chain dashboards.
-
What metrics should be in an operations dashboard?
The metrics depend on your goals. For marketing, it could be leads and conversion rates. For sales, it might be pipeline value and win rates. The idea is to include numbers that directly influence decisions.
-
What is the difference between strategic and operational dashboards?
Operational dashboards focus on day-to-day performance, while strategic dashboards look at long-term goals and overall progress. One helps you act quickly, the other helps you plan.
-
How often should operational dashboards be updated?
Most operational dashboards work best when updated in real time or near real time. This ensures that decisions are based on the latest data available.


