You set a goal, put in the work, and wait. But after a few weeks, you’re not sure if anything’s actually moving in the right direction. The numbers are there, but they don’t really tell you what’s working or what needs to change. That’s where KPIs come in. A KPI, or Key Performance Indicator, helps you track the things that matter most and visualise progress clearly in a KPI dashboard. Whether you’re growing a small business, managing a team, or improving a project, KPIs give you a clear way to measure progress. In this guide, we’ll break down what KPIs are, the types you should know, real examples, and how to build ones that actually help you move forward. Let’s jump right into it.
Key Takeaways
- Focus on the KPIs that really matter. Not every data point is a KPI. Choose the ones that clearly support your main goals.
- Mix both leading and lagging indicators. Leading indicators help you predict what’s coming, while lagging indicators confirm what already happened.
- Every KPI needs to be clearly defined. Make sure it has a target, someone responsible for tracking it, how often it’s reviewed, and where the data comes from.
- Don’t overload your plan with too many KPIs. Stick to about 5 to 8 per plan so your team can stay focused and accountable.
- Make sure you’re acting on KPIs, not just reporting them. Use dashboards and regular review sessions to adjust course when needed.
What is KPI?
KPI stands for Key Performance Indicator. It’s a measurable value that shows how well a person, team, or business is doing in relation to specific goals. KPIs help you track progress, spot problems, and make better decisions. Instead of just guessing if something is working, a KPI gives you real numbers to look at.
Think of a KPI as a progress marker. If you’re running a business, you might track sales growth. If you’re managing a website, you might look at how many visitors become customers. By keeping an eye on the right KPIs, you can focus on what matters most and make changes when things aren’t on track.
What Are the Key Components of a KPI?
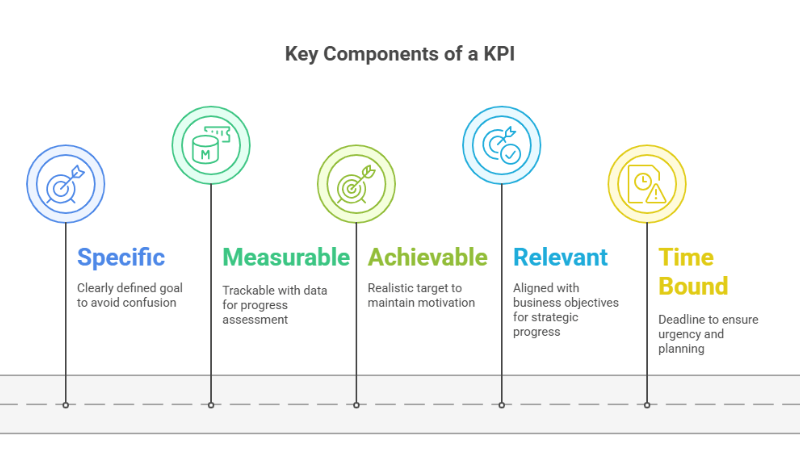
If you want a KPI to actually guide performance and track progress, it needs to be more than just a vague goal. A strong KPI is built on five important components that make it clear, useful, and measurable. Here’s what to keep in mind when you’re setting one up:
-
Specific
A KPI needs to be clearly defined so there is no confusion about what you are trying to achieve. Vague goals lead to vague results. When your KPI is specific, everyone knows exactly what success looks like. For example, instead of saying “increase sales,” it is clearer to say “increase monthly sales revenue by 10 percent.” This clarity helps teams focus their efforts in the right direction.
-
Measurable
You need to be able to track your KPI with data. Whether it’s a number, percentage, or ratio, there should be something you can count. If you cannot measure it, you cannot manage it. Measurable KPIs make it easier to check progress and make decisions based on real results.
-
Achievable
While it’s good to challenge your team, a KPI should still be realistic. If the target feels impossible, it may lead to frustration instead of motivation. Setting achievable goals helps keep people focused and moving forward within the resources and time they have.
-
Relevant
Every KPI should link back to a larger business objective. If the KPI doesn’t support your strategy, it won’t help you make real progress. Relevance makes sure your team is spending time on what truly matters to the organisation.
-
Time Bound
A good KPI needs a deadline. Without a clear time frame, goals can drag on without urgency. Adding an end point like “by the end of Q2” or “within 30 days” helps teams plan, take action, and stay on track.
KPIs vs. Metrics
KPIs and metrics may look similar at first, but they serve different purposes, and understanding the difference helps you track progress more clearly. Metrics focus on everyday activities and processes, such as website traffic, app uptime, or sales from a specific channel, while KPIs are tied directly to your bigger business goals. A KPI shows you how close you are to reaching a target and often relies on several supporting metrics to give you the full picture.
For example, if your goal is to increase sales by 50 percent next quarter, your KPI could be the total number of products sold, while metrics like visitor numbers, app availability, and channel wise sales help you understand what is driving that growth. Metrics usually belong to a specific person or team, but KPIs cut across departments, meaning marketing, product, research, and sales all play a role in reaching the same outcome. When you look at both together, you can see what is working, what needs improvement, and where to focus your efforts to move closer to your goals. Here’s a table that breaks down the diffrence between both:
| Aspect | KPI | Metric |
| What it Represents | A KPI shows progress toward a clear business or strategic objective. It helps leadership understand whether goals are being met. | A metric measures how an activity, process, or system is performing at a given point in time. |
| Purpose | Used to evaluate success against defined outcomes that matter to the business. | Used to observe performance, trends, or behaviour without directly tying it to a business goal. |
| Target and Timeframe | Always linked to a specific target and a set time period. This helps teams stay accountable. | May or may not have a target. Often used for monitoring rather than goal tracking. |
| Scope | Operates at a broader level such as company-wide, department-level, or major initiative level. | Works at a more detailed level such as tasks, channels, systems, or daily operations. |
| Decision Impact | Directly influences decisions, planning, and prioritization. | Supports analysis but usually does not drive decisions on its own. |
| Ownership | Clearly assigned to an owner or team, with regular review and reporting. | Often tracked by teams or systems without a fixed review cadence. |
| Change Over Time | KPIs remain stable unless business priorities change. | Metrics can change frequently based on what is being measured. |
| Example | Increase MQL to SQL conversion rate to 25 percent by the end of Q3. | Website sessions grouped by traffic source. |
Types of KPIs: Understanding What to Measure and Why
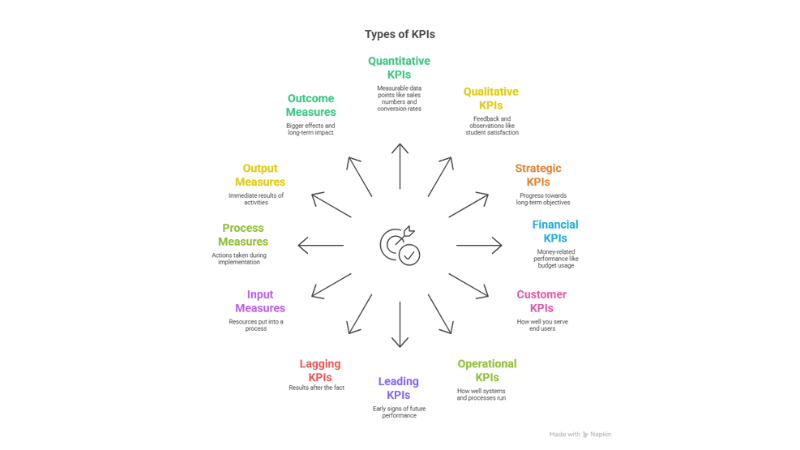
When you’re tracking performance, not all KPIs serve the same purpose. Some give you quick data points, while others help you look at the bigger picture. This section breaks down the different types of KPIs you might come across, so you can choose the right ones based on what you want to track, improve, or understand better.
-
Quantitative KPIs
Quantitative KPIs are all about numbers. These indicators are measurable, easy to track, and give you a clear idea of how well something is performing. Think of things like sales numbers, conversion rates, traffic volume, or attendance percentages. If you can put it into a spreadsheet and chart its progress, it’s likely a quantitative KPI. These are often the first metrics people look at because they give direct evidence of results.
-
Qualitative KPIs
Qualitative KPIs focus on feedback, observations, and experiences. These are not easily counted but are still important. For example, student satisfaction, team morale, or the quality of classroom discussions can all be considered qualitative. You may use surveys, interviews, or open-ended responses to gather this data. These indicators help you understand the story behind the numbers and give insight into how people feel or what they think.
-
Strategic KPIs
Strategic KPIs are tied to big-picture goals. These indicators track progress toward long-term objectives and help align daily actions with your mission. For example, improving overall student performance across the school year or reducing dropout rates might be a strategic KPI for a school. These help keep everyone focused on long-term outcomes rather than just short-term wins.
-
Financial KPIs
Financial KPIs help track money-related performance. These might include budget usage, cost savings, grant allocations, or return on investment for programs or tools. In a school setting, you might use financial KPIs to track spending on edtech tools or to see how efficiently you’re using available funds. They show whether financial decisions are helping or hurting overall goals.
-
Customer KPIs
Customer KPIs focus on how well you are serving your end users. In education, this could mean tracking student satisfaction, parent feedback, or community engagement. These indicators help you stay connected to the people you serve and make sure your efforts are actually making a difference in their experience.
-
Operational KPIs
Operational KPIs deal with how well your systems and processes are running. These include things like lesson plan completion, assignment submission rates, attendance tracking, or IT ticket resolution times. If something involves day-to-day operations, it likely falls under this category. These indicators help make sure everything is running smoothly behind the scenes.
-
Leading KPIs
Leading KPIs predict what might happen next. They are early signs that give you a chance to make changes before things go wrong. For example, if fewer students are logging into your LMS or if engagement drops suddenly, these could be leading indicators of lower performance later. They help you stay ahead of issues by showing patterns early.
-
Lagging KPIs
Lagging KPIs tell you what already happened. They confirm results after the fact. Test scores, graduation rates, and completed project reports are examples of lagging indicators. These are useful for evaluation and reflection but do not give you time to act in the moment. They help measure the final impact of your efforts.
-
Input Measures
Input measures track the resources you are putting in. This might include time, money, tools, or training provided. For example, hours spent on teacher development workshops or number of tablets distributed to students. Input KPIs help you understand what you’re investing to make a result possible.
-
Process Measures
Process measures track the actions and steps taken during implementation. These could include number of lessons delivered, assignments created, or student-teacher interactions logged. They tell you whether the planned activities are happening as expected. Monitoring these helps ensure the system is working before looking at outcomes.
-
Output Measures
Output measures focus on immediate results. These include things like completed projects, submitted assignments, or number of students who passed a unit. They are short-term results that happen right after an activity is done. Output KPIs give you a snapshot of productivity and short-term success.
-
Outcome Measures
Outcome measures look at the bigger effect. These track whether the activity led to a real impact. Did the training improve teaching quality? Did the new strategy raise test scores? These indicators take time to show but are often the most meaningful. They reflect true growth and achievement.
How to Make KPI?(Step-by-Step)
Creating KPIs that actually help you track performance, measure progress, and drive decisions starts with a bit of planning. Below is a step-by-step process that walks you through how to design meaningful KPIs that stay useful in the long run.
Step 1: Align With Strategic Objectives
Start by asking a simple question: What are we trying to achieve as a team or organisation? Your KPIs should directly reflect those goals. If your school wants to improve student engagement, your KPI might focus on participation rates in class or attendance in extracurricular sessions. If your department wants faster project turnaround, then task completion times might be the metric to watch.
Avoid KPIs that look good on paper but do not actually support your broader mission. Keep it focused. Every KPI should serve a real, measurable purpose that moves you closer to the main goal.
Step 2: Specify the Details
Now that your KPI is linked to a goal, break it down into these parts:
- Measure: What exactly are you tracking? For example, “Customer Support Response Time.”
- Target: What number are you aiming for? It could be “under 4 hours.”
- Owner: Who is responsible for tracking and achieving this KPI? Assign a person or team.
- Frequency: How often will you check progress? Daily, weekly, or monthly?
- Data Source: Where will the data come from? This could be a CRM, analytics tool, survey, or spreadsheet.
Filling out these details keeps things clear and avoids confusion later. Everyone involved knows what’s being measured, how often, and where the numbers are coming from.
Step 3: Make KPIs SMART
Before you lock anything in, test your KPI against the SMART framework. This step keeps it realistic and useful.
- Specific: Is it focused enough?
- Measurable: Can you actually track it with data?
- Achievable: Is it doable given your current resources?
- Relevant: Does it relate directly to your main objective?
- Time-bound: Is there a clear time frame for tracking or achieving it?
Instead of saying “Improve communication,” a SMART version would be “Increase weekly parent email response rate to 90% by end of term.” Now it’s something you can actually work toward and measure.
Step 4: Establish Baselines and Benchmarks
Before you can say whether you’re improving, you need to know your starting point. That’s your baseline.
You can gather historical data to find this. If your current churn rate is 6%, that becomes your baseline. Then look at industry standards or competitor data to set benchmarks. This gives you a reference point to understand whether your target is too easy, too hard, or right where it should be.
Baselines help you track progress over time. Benchmarks help you understand how you compare to others.
Step 5: Review, Report, and Iterate
Once KPIs are in place, don’t just let them sit. Track them regularly and report progress. Share the results with your team or stakeholders so everyone stays on the same page.
Use dashboards, weekly updates, or monthly review meetings to keep the numbers visible. When something changes or a target is not being hit, don’t be afraid to adjust the KPI or rethink the strategy behind it.
KPIs are not meant to be static. Keep refining them so they stay useful as goals shift and teams grow.
KPI Examples by Department
Now let’s look at some real-world examples across different areas.
-
Sales and Marketing KPIs
These KPIs help you understand how well your business is attracting and converting customers. They focus on money coming in, new customers, and how well your marketing efforts are working.
- Sales Revenue Growth: This shows how much your total sales have increased or decreased over time. A steady growth tells you the business is expanding, while a drop might signal a need to change your sales or marketing strategy.
- Customer Acquisition Cost (CAC):This tells you how much you spend to get a new customer. If it’s too high, you may need to tweak your ads, improve targeting, or work on customer retention. Lower CAC usually means better efficiency.
- Website Conversion Rate: This shows the percentage of people who visit your website and take a specific action, like buying something or filling out a form. A high conversion rate means your website is doing a good job turning visitors into customers.
- Marketing Qualified Leads (MQLs): These are potential customers that your marketing team has identified as more likely to make a purchase. Tracking MQLs helps you see how well your marketing is generating serious interest.
-
Financial KPIs
These help you keep track of your business’s financial health and long-term stability. They are especially useful for budgeting, forecasting, and showing investors how the company is doing.
- Net Profit Margin: This tells you what percentage of your total revenue is actual profit after covering all expenses. A higher margin means your business is keeping more of what it earns.
- Return on Investment (ROI): ROI helps you see if the money you put into a project, campaign, or product is paying off. It compares the return (profit) to the cost of the investment.
- Accounts Receivable Turnover: This shows how quickly your business is collecting payments from customers. A higher turnover means your cash flow is healthy, and you’re not waiting too long to get paid.
- Operating Expense Ratio: This compares your operating costs to your total revenue. If this ratio is high, it might be time to review where the business is overspending.
-
Operational and Supply Chain KPIs
These KPIs measure how efficiently your internal systems are working. They help you improve processes, reduce waste, and deliver better results.
- On-Time Delivery (OTD): This tracks the percentage of customer orders that are delivered on or before the promised date. High OTD means your supply chain is running smoothly and customers are more likely to be satisfied.
- Defect Density: This counts how many defects or errors are found in a product or process. Keeping this number low means your quality control is working well.
- Inventory Turnover: This shows how quickly your inventory is being sold or used. A high turnover means products are moving quickly and storage costs are low. A low rate might signal overstocking or low demand.
- Production Throughput: This measures how much finished product your system produces in a given time. It helps you understand if your operations are running at full capacity or if there are bottlenecks slowing things down.
-
Customer Service and Experience KPIs
If you’re measuring how well your support or service teams are doing, these KPIs help you understand the full picture. They focus on how satisfied your customers feel, how likely they are to stick around, and how efficient your support operations are.
- Customer Satisfaction Score (CSAT): This tells you how happy customers are after a specific interaction. Usually, you ask them to rate their experience right after a call, chat, or purchase.
- Net Promoter Score (NPS): This helps you know how loyal your customers are. You ask one simple question: how likely they are to recommend your company to others.
- Average Handle Time (AHT): This shows how long your team spends on each customer interaction, from start to finish. It helps you track efficiency and spot delays.
- Customer Churn Rate: This tells you how many customers stopped using your service or left during a certain time. A rising churn rate can be a signal that something needs fixing in the customer journey.
-
Human Resources (HR) KPIs
These KPIs help you track how your team is doing behind the scenes. They show how well you’re hiring, retaining, and keeping your employees engaged.
- Employee Turnover Rate: This shows the percentage of employees who leave during a specific period. It helps you spot patterns and think about what could be causing people to quit.
- Employee Engagement Score: This tells you how connected employees feel to their work and your goals. It can come from surveys, feedback tools, or pulse checks.
- Time to Hire: This measures how long it takes to fill a job role. Tracking this helps you improve your hiring process and avoid long vacancies.
- Absenteeism Rate: This tracks how often employees miss work. High absenteeism might point to stress, low morale, or other issues that need attention.
Explore Popular Digital Marketing KPI Examples:
- Digital Marketing KPIs – Track overall campaign performance and ROI
- PPC KPIs – Measure ad spend efficiency, clicks, and conversions
- SEO KPIs – Monitor rankings, organic traffic, and search visibility
- Email Marketing KPIs – Evaluate open rates, CTRs, and subscriber growth
- Influencer Marketing KPIs – Track reach, engagement, and creator ROI
- Social Media KPIs – Measure engagement, reach, and audience growth
- Facebook KPIs – Analyse ad performance, reach, and interactions
- LinkedIn KPIs – Track B2B engagement, leads, and conversions
- Instagram KPIs – Measure content engagement, reach, and follower growth
- Twitter KPIs – Track impressions, engagement, and follower activity
Common KPI Pitfalls and How to Avoid Them
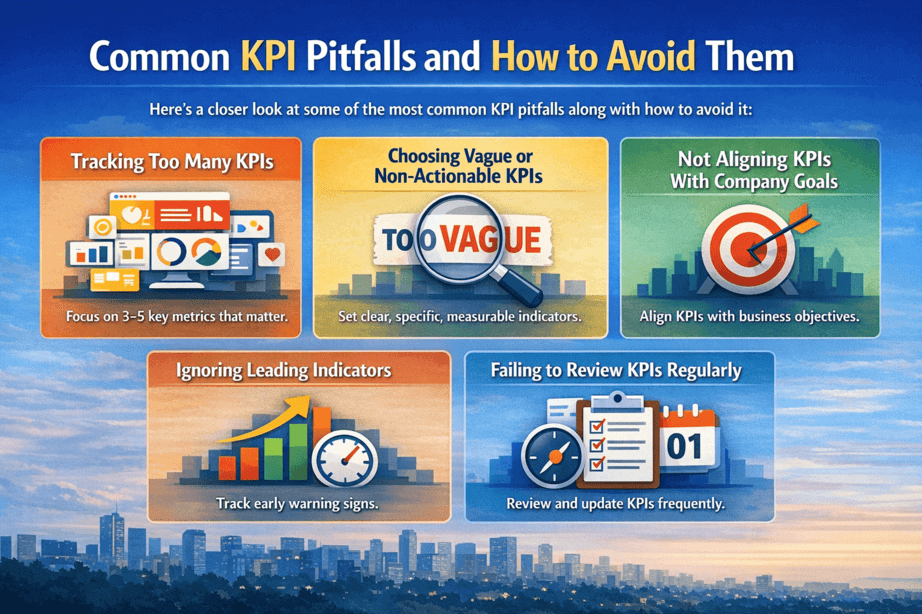
Here’s a closer look at some of the most common KPI pitfalls along with how to avoid it:
-
Tracking Too Many KPIs
Trying to track every possible KPI can backfire. When there are too many numbers on the dashboard, it becomes hard to focus on what actually matters. Teams start chasing every small metric, lose track of priorities, and end up wasting time on reports that do not lead to real decisions.
To avoid this, narrow your focus to the KPIs that truly reflect progress. Choose three to five meaningful indicators that clearly connect to your goals. Make sure each one serves a purpose. Less is more when it comes to driving clarity and action.
-
Choosing Vague or Non-Actionable KPIs
Some KPIs sound impressive but do not tell you anything specific or useful. Words like “brand visibility” or “customer engagement” might sound important, but unless they are tied to measurable data, they end up just filling space.
The fix here is to make your KPIs clear, specific, and tied to real actions. Instead of “customer satisfaction,” try using “Net Promoter Score” or “Repeat Purchase Rate.” Use numbers, set timeframes, and make sure your team knows what success looks like and what they can do if the metric dips.
-
Not Aligning KPIs With Company Goals
It’s easy to pick KPIs that look good on paper but have nothing to do with what the company is really trying to achieve. This disconnect causes teams to work hard without moving the business forward in the right direction.
To fix this, start with the big picture. Look at your company’s main goals and then work backwards. Every KPI you choose should directly support those larger targets. Whether it’s growth, retention, efficiency, or revenue, your KPIs need to pull in the same direction.
-
Ignoring Leading Indicators
Many teams focus too much on lagging indicators like revenue or profit, which only show what has already happened. By the time these numbers change, it’s often too late to adjust anything.
That’s why you need to balance lagging indicators with leading ones. Track metrics that give you an early signal, like conversion rates, demo requests, cart abandonments, or user onboarding success. These help you spot trends early and make smarter decisions before results drop.
-
Failing to Review KPIs Regularly
Choosing the right KPIs is not a one-time task. Many businesses set their KPIs at the start of the year and then forget to revisit them. But goals shift, markets change, and teams evolve. Sticking to outdated KPIs means flying blind.
Make it a habit to review your KPIs at regular intervals. Monthly or quarterly check-ins help you see if the metrics are still relevant and if you need to adjust your targets or strategy. Staying flexible keeps your team aligned with what matters right now.
KPIs vs. OKRs and How They Work Together
You don’t have to choose between KPIs and OKRs. The smart move is to use both, because they serve different purposes and actually support each other.
OKRs are where you define what you want to achieve. KPIs tell you how things are going along the way. Let’s say your objective is to grow revenue this quarter. Your key results might include signing 10 new enterprise clients or increasing average deal size by 20 percent. But to track progress, you’ll still need KPIs like daily SQLs, pipeline value, or average sales cycle time. These are the signals that show whether you’re heading in the right direction.
When used together, OKRs push the team to aim higher, while KPIs keep the process grounded. KPIs give you ongoing performance data. OKRs give you clarity on where that performance should lead. If your KPIs plateau, your OKRs will force you to ask what needs to change. If you hit your OKRs, your KPIs will help you understand what actually worked.
This combo also keeps teams aligned. Everyone knows what the goal is, and they also know which metrics matter week to week. It reduces noise, avoids over-measuring, and keeps your strategy tied directly to execution.
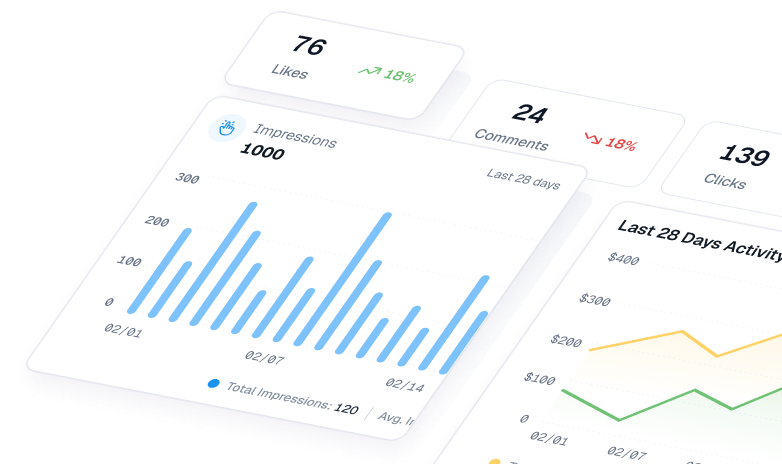
How ViewMetrics Helps
ViewMetrics takes the stress out of marketing KPI reporting by handling most of the work for you. Instead of juggling spreadsheets or pulling numbers from different platforms, you just connect your marketing accounts and choose a template. The tool does the rest. It adds charts, pulls in screenshots, and fills in all the important numbers for you.
You also get a centralized KPI dashboard where you can see everything in one place. Whether you want daily updates or a monthly report, ViewMetrics syncs the data on your schedule. It works smoothly with Google Slides and Sheets, so your presentations and reports stay updated without extra effort.
You can download charts easily, manage multiple workspaces, and even collaborate with your team without wasting time. By automating all the repetitive parts of reporting, ViewMetrics helps you focus more on strategy and less on chasing numbers.
Closing Thoughts
KPIs help turn goals into something you can actually track and act on. When you choose the right indicators, review them regularly, and use them to guide decisions, they stop being just numbers on a dashboard and start driving real progress. Whether you are managing a team, a campaign, or an entire business, well-defined KPIs give you clarity, focus, and a clear sense of what needs attention next.


View All Your Marketing and Website Data - Instantly
 Connect Instagram, Mailchimp, Google Analytics & more
- Pre-built dashboards, no setup needed
- Save hours on reporting every week
Frequently Asked Questions (FAQs)
-
What are the 4 P’s of KPI?
The 4 P’s of KPI usually refer to Purpose, Performance, Process, and People. They help you understand why you’re tracking something, what outcome you want, how it will be measured, and who is involved in meeting that goal.
-
What is KPI for an employee?
A KPI for an employee is a specific target or performance measure tied to their role. It could be anything from meeting deadlines to closing a certain number of tasks. It helps both the employee and manager track progress in a clear and structured way.
-
What is an example of a metric and KPI?
A metric is just a number you track, like website traffic. A KPI takes that further by tying it to a goal, like increasing traffic by 20 percent in 3 months. All KPIs are metrics, but not all metrics are KPIs.
-
What is the difference between KPIs and metrics?
Metrics are general numbers or data points. KPIs are the important ones that directly link to your goals. If a number tells you how you’re doing but doesn’t help you make decisions, it’s likely just a metric.
-
How many KPIs should a team track?
Try to keep it focused. Most teams do well with 3 to 5 solid KPIs. Too many can get confusing and take attention away from what really matters.
-
What are leading vs lagging indicators?
Leading indicators help you predict results. Lagging indicators show you what already happened. For example, the number of leads is a leading indicator. Total sales at the end of the month is lagging.
-
How do you set SMART KPI targets?
SMART targets are Specific, Measurable, Achievable, Relevant, and Time-bound. Instead of saying “get better at sales,” you say “increase sales by 10 percent in the next quarter.”
-
How often should you review KPIs?
You should check on them regularly. Some KPIs might need a weekly look, while others make more sense monthly or quarterly. It depends on how fast your team moves and how often decisions need to be made.
-
How to benchmark KPIs against competitors?
Start by looking at industry reports, public data, or case studies. Tools like SEMrush, SimilarWeb, or LinkedIn insights can give you useful comparisons. The goal is not to copy, but to understand where you stand.
-
What’s the best way to visualize KPIs?
Dashboards work best. You can use tools like Google Looker Studio, Tableau, Power BI, or even Notion. Use bar charts, line graphs, or gauges that make trends easy to spot at a glance.
-
How do you avoid vanity metrics?
Ask yourself if the metric helps you make a decision. If it looks good on paper but doesn’t change anything you do, it’s a vanity metric. Focus on numbers that show progress or reveal a problem.
-
How do KPIs align with OKRs?
KPIs measure progress. OKRs (Objectives and Key Results) set the direction. A good KPI will show whether a key result in your OKR is being met. You can think of KPIs as proof that your OKRs are working.
-
Which KPIs should I track first for a new business?
Start with KPIs linked to customer growth, cash flow, and product performance. These could be new users, cost per acquisition, and customer retention. Focus on survival and growth in the early stages.
-
Do I need a dashboard tool to track KPIs?
Not always. You can start with spreadsheets or even paper if it’s simple. But once your data grows, a dashboard tool saves time, reduces errors, and helps your team stay on the same page.
-
How many KPIs per department are ideal?
Keep it between 3 to 7 per department. That’s enough to cover the important areas without getting lost in too many details. Make sure each KPI actually helps someone take action.
-
Are KPIs worth it for small teams?
Yes, they help you stay focused even with limited resources. A small team can use KPIs to track what’s working, avoid waste, and stay on the same path without micromanagement.
-
What KPIs actually improved your revenue?
This depends on your business, but common ones include conversion rate, average order value, repeat customer rate, and churn rate. When tracked properly, these often point to actions that grow revenue.
-
What’s the worst vanity metric you stopped tracking?
Many people stop tracking social media likes or page views because they look good but don’t reflect true engagement or conversions. Instead, they move to KPIs that drive action like sign-ups or purchases.
-
How do I pick KPI targets without historical data?
Use industry benchmarks or start with a safe guess based on what feels realistic for your current team size and effort. You can always adjust once you get a few weeks or months of data.
-
What tools do you use for KPI dashboards?
Popular ones include Viewmetrics, Google Looker Studio, and even Excel with charts. Pick one that fits your data size and budget. The tool should help you spend less time tracking and more time improving.